
BTCUSD closed at 84381.78, above the daily resistance zone that was broken at 82844.58. The daily chart shows a bullish change in structure and an upward sub-trend, but the weekly main trend remains firmly down, leaving the breakout subject to confirmation.
Higher-timeframe context
The weekly main trend is down, with an upward sub-trend and no reported structure event. The most recent confirmed weekly swing is a low at 59783.75. The weekly close at 81237.55 sits within the 80538.63 – 84683.30 broken-retest resistance zone, so this area remains important context rather than an unambiguous clearance.
Above, the next reported weekly resistance zone is 94752.29 – 97971.19. The weekly support zone is 59783.75 – 69241.82. Overall, the higher timeframe permits a continued recovery if price can hold above the reclaimed area, but its main trend still argues for caution.
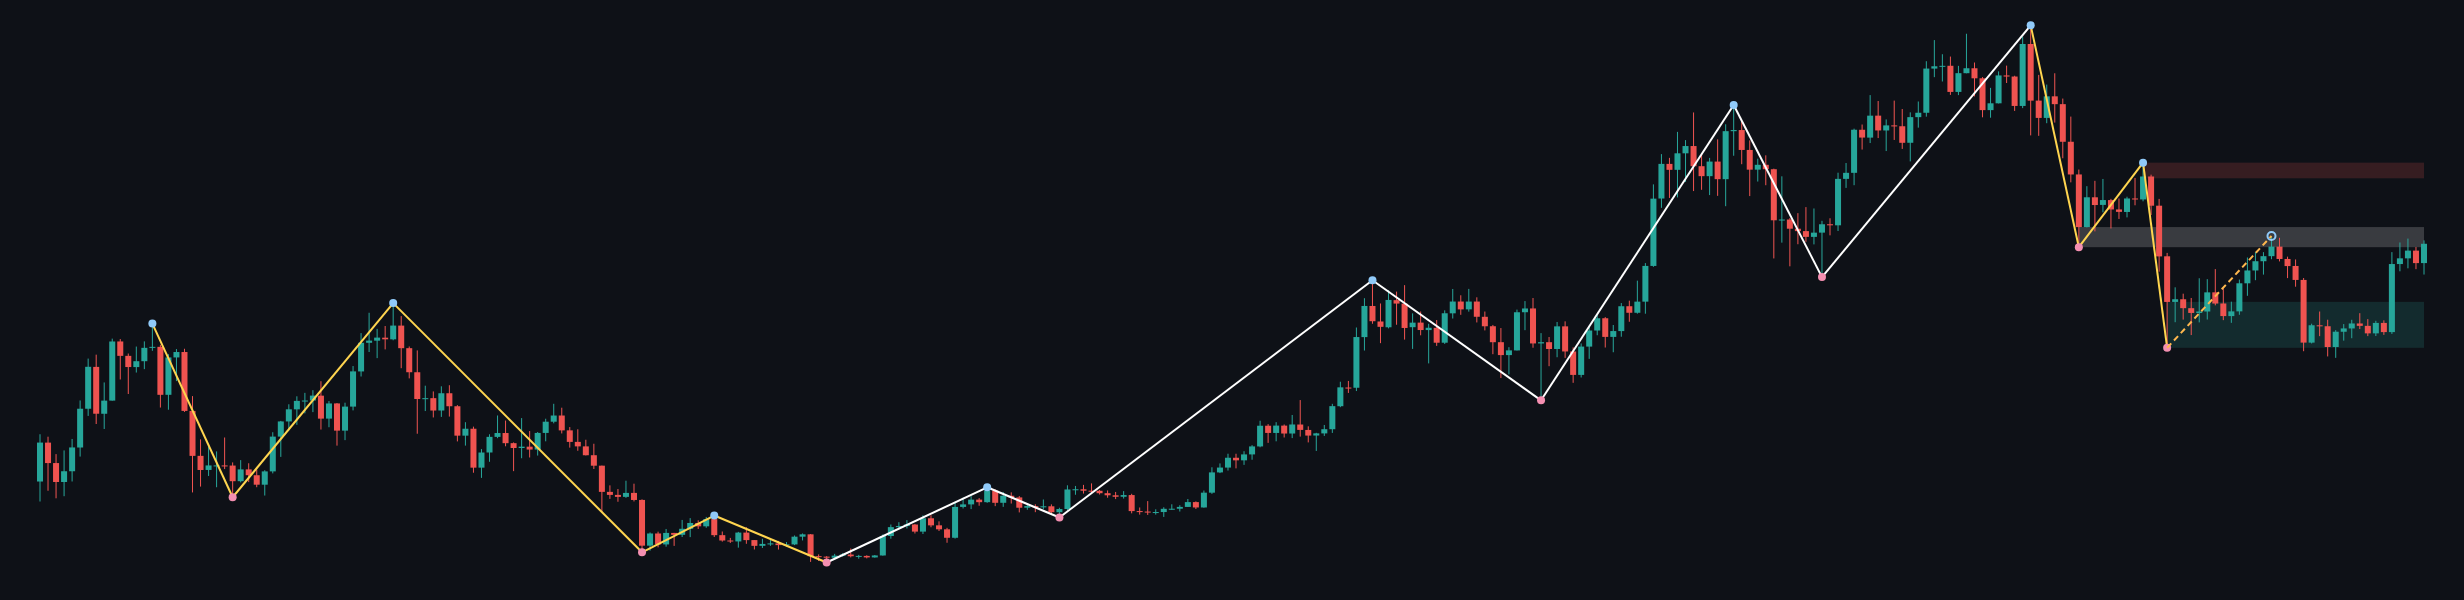
Main-frame structure
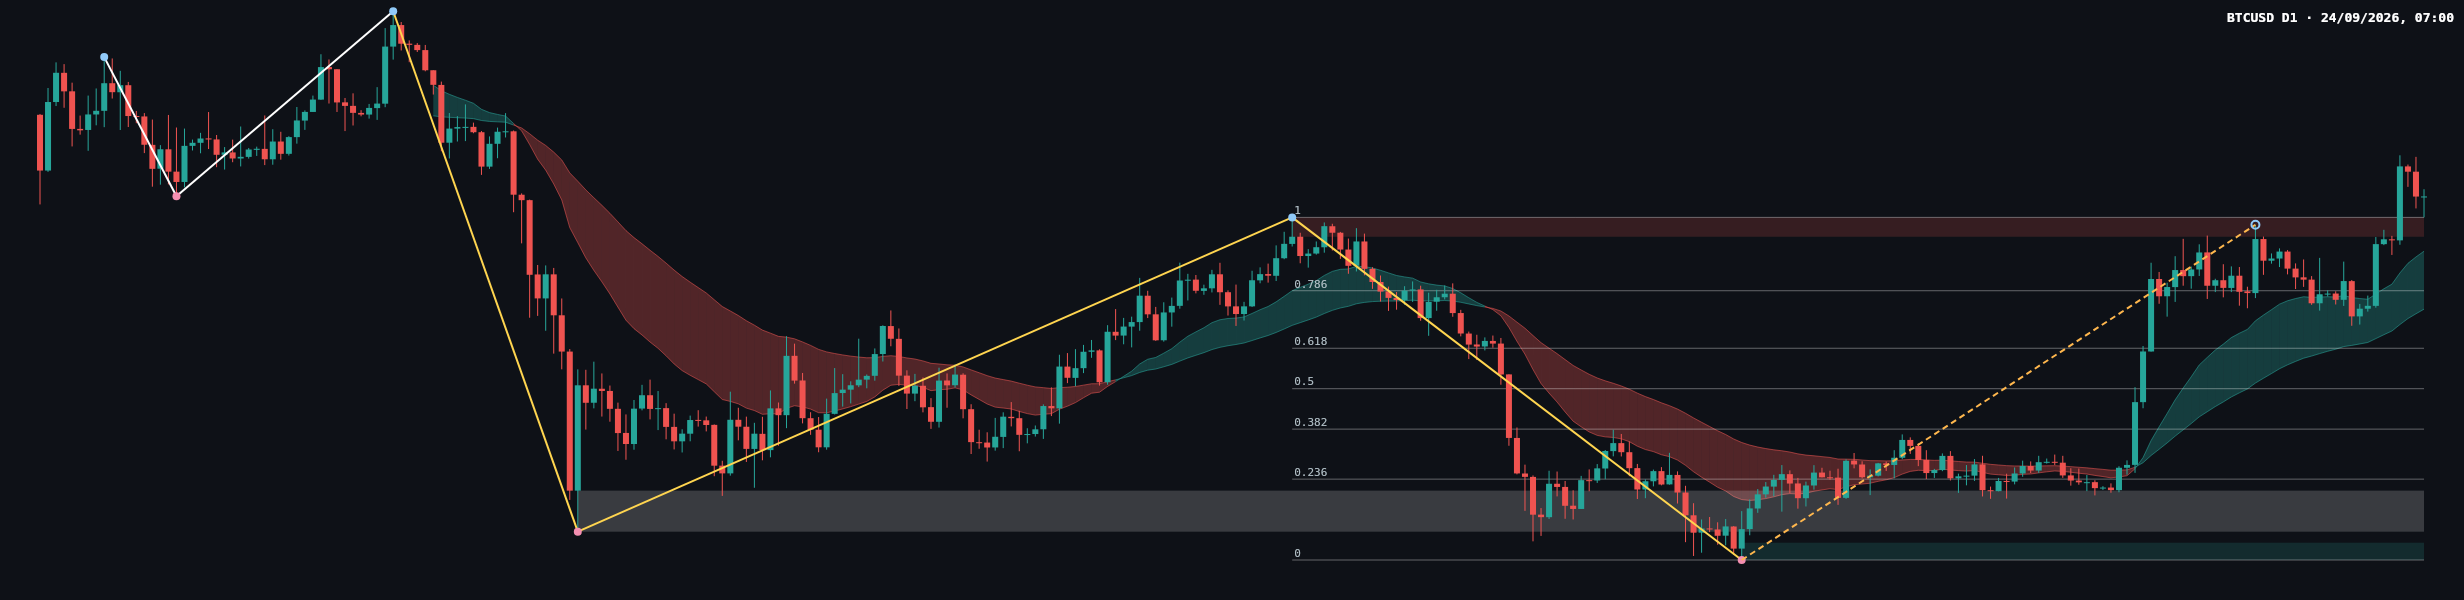
The daily main trend is down but shaky, while its sub-trend is up. The reported change of character is tied to a break of 82844.58; the latest close at 84381.78 is above that level and above the daily resistance zone of 81426.29 – 82844.58. This is a constructive shift on the daily chart, though it does not by itself erase the higher-timeframe downtrend.
The latest completed Dow leg has a reported retracement ratio of 1.000, reaching its 82844.58 endpoint. Price has moved above that reference. The chart also shows a sharp recent rise through the former daily resistance area, followed by candles near the upper part of the displayed range. Exact candle measurements and EMA values are not provided in the report, so they cannot be assessed here.
The daily support zone is 57704.79 – 58970.62. A separate broken-retest zone is 59783.75 – 62793.85. These are substantially below current price; a decline toward them would require a meaningful reversal from the present structure.
Key levels
- 81426.29 – 82844.58: daily resistance zone, now the key area to monitor as potential support after the reported break.
- 80538.63 – 84683.30: weekly broken-retest zone containing the latest weekly close.
- 94752.29 – 97971.19: higher weekly resistance zone if the recovery extends.
- 59783.75 – 69241.82: weekly support zone; the daily support zone is 57704.79 – 58970.62.
Scenarios
Bullish continuation
If price holds above 82844.58 and sustains the daily structural break, the recovery could continue, with the weekly resistance zone at 94752.29 – 97971.19 a notable area overhead. A return below 81426.29 would weaken this scenario by putting price back beneath the daily resistance zone.
Bearish rejection
If price falls back below 81426.29 and fails to reclaim the daily zone, the break above 82844.58 may prove unsustained. That would put the lower reported support areas back in focus, including weekly support at 59783.75 – 69241.82. A sustained recovery above 82844.58 would weaken this bearish reading.
Closing view
The daily structure has improved after the break of 82844.58, while the weekly trend remains down and price is still within its broader broken-retest zone. Whether the daily market can hold above 81426.29 – 82844.58 is the central test for the recovery.
This analysis is for informational purposes only and is not investment advice. Markets carry risk, and readers are responsible for their own decisions.