
BTCUSD is attempting to recover within a broader bearish framework. The latest closed price on the daily chart is 78443.13, while the weekly context closed at 79827.21. The most notable feature is the clash between a shorter-term upward move and firm resistance overhead at 81426.29–82844.58 on the daily frame.
| Metric | Reading |
|---|---|
| Daily close | 78443.13 |
| Weekly context close | 79827.21 |
| Weekly and daily trend | Firmly down, with an upward sub-trend |
| Nearest resistance | 81426.29–82844.58 |
| Nearest support area | 59783.75–62793.85 on the daily broken-retest structure |
| Daily Fibonacci reference | 0.786 at 77464.66; retracement ratio 0.825 |
| Daily ATR | 2282.06 |
Higher-timeframe context
The weekly chart keeps the main trend classified as down, and the report describes that trend as firm. The upward sub-trend is therefore best treated as a countertrend recovery until price proves otherwise. No weekly structure event has been recorded, so there is no confirmed break that would overturn the prevailing bearish framework.
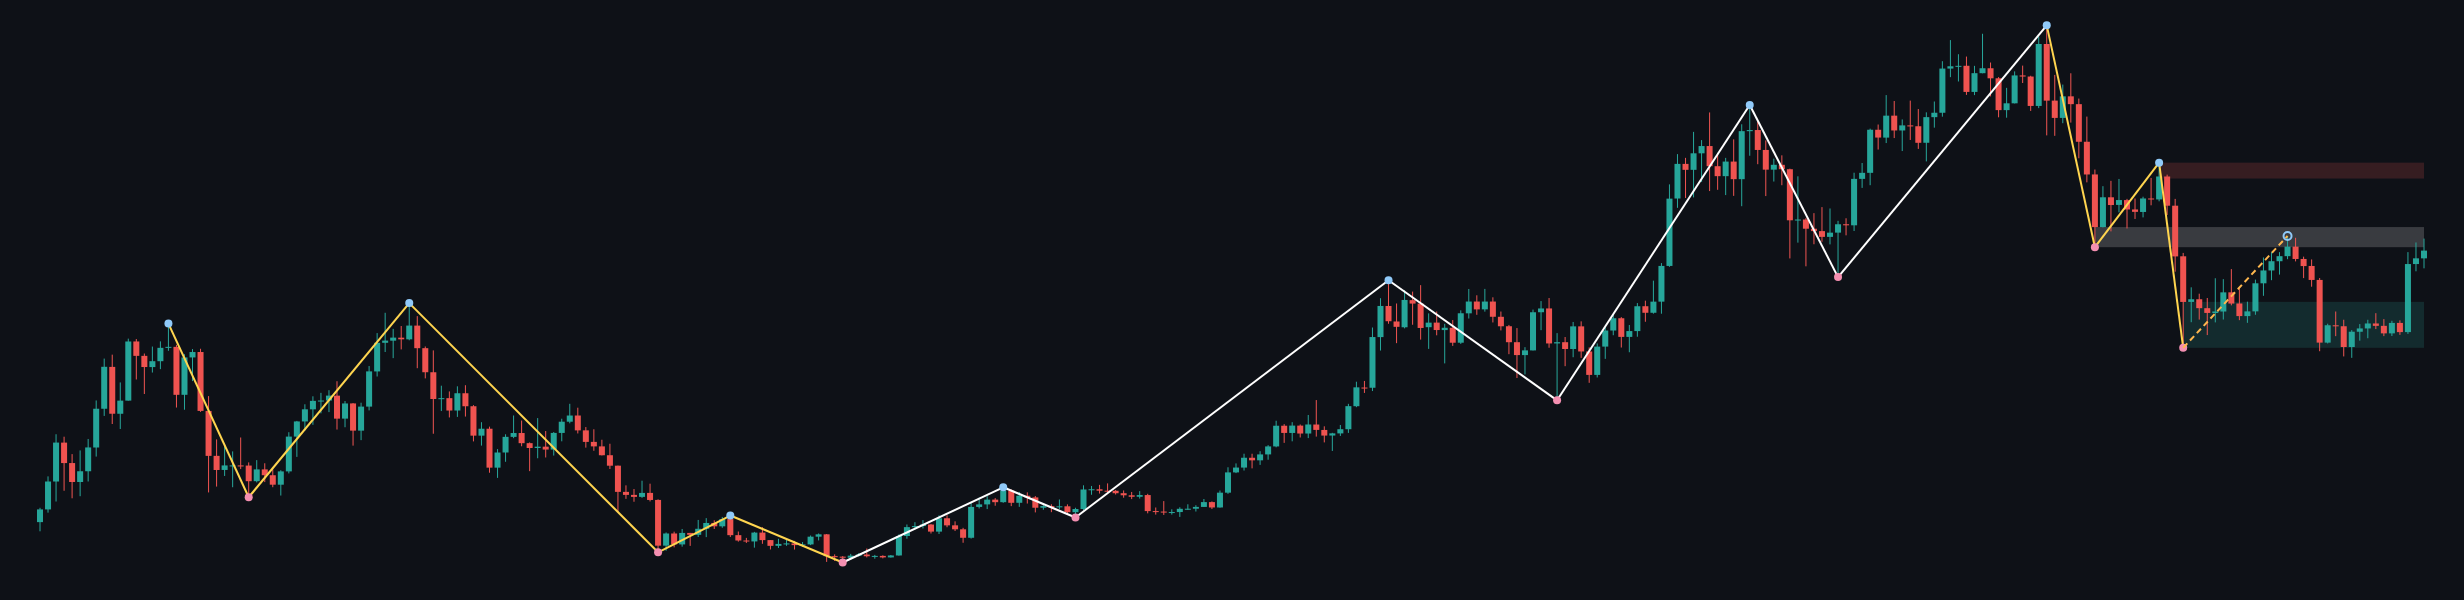
The most recent confirmed weekly swing is the low at 59783.75. Above the market, the wider weekly resistance zone is 94705.30–97971.19. A nearer weekly resistance area at 80538.63–84683.30 is marked as broken-retest resistance. This zone overlaps the daily resistance region and makes the area around 81426.29–82844.58 particularly important for assessing whether the recovery can develop into a larger reversal.
Weekly support is located at 59783.75–69241.82. The weekly ATR is 6531.77, indicating that movement around the major zones can be substantial. Weekly Fibonacci detail is not provided in the deterministic report, so interaction with a specific weekly Fibonacci level is not determinable here.
Main-frame structure
The daily frame also has a firm downtrend with an upward sub-trend, so it aligns with the weekly direction while showing a recovery inside that larger decline. The daily chart has no recorded structure event. That means the rebound has not yet produced a confirmed break of the established bearish structure.
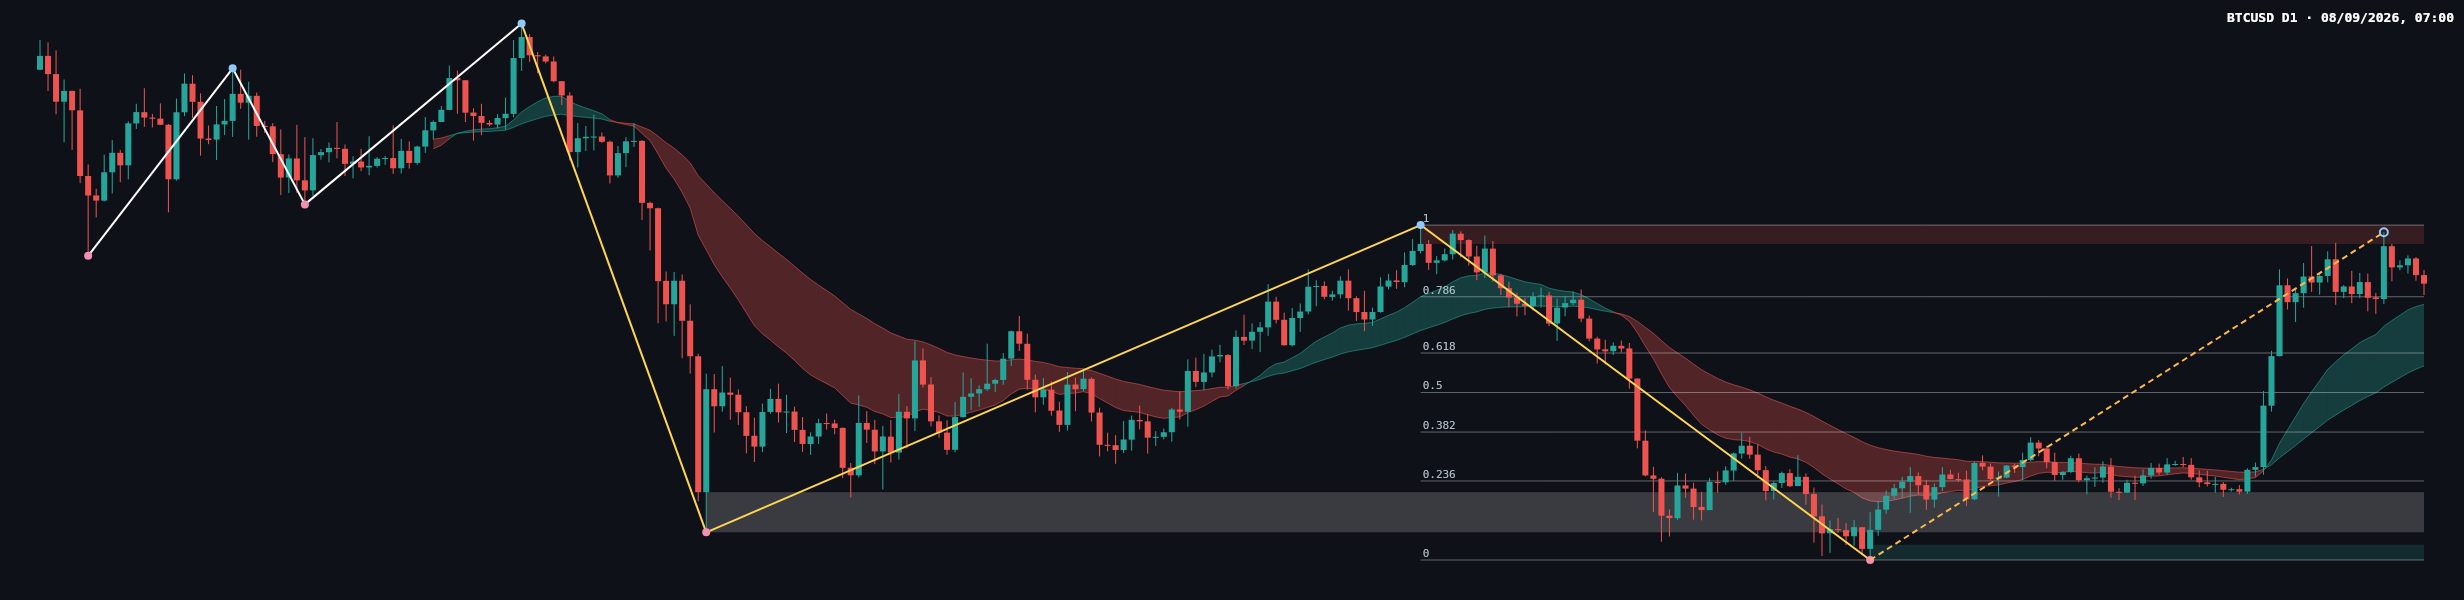
The daily broken-retest resistance zone is 59783.75–62793.85, while the latest daily confirmed swing low is 57704.79. The currently relevant overhead supply is 81426.29–82844.58. The broader support zone is 57704.79–58845.82, placing the confirmed swing low directly at the upper boundary of that area.
The latest completed Dow leg runs from 57704.79 to 82844.58. Its retracement references are 63637.78 at 0.236, 67308.19 at 0.382, 70274.69 at 0.5, 73241.18 at 0.618, and 77464.66 at 0.786. With the current retracement ratio at 0.825, price has recovered beyond the 0.786 reference but remains below the leg high at 82844.58.
Key levels and recent price behaviour
The latest close at 78443.13 is above the 0.786 Fibonacci reference at 77464.66, but it remains below the daily resistance zone at 81426.29–82844.58. This places price in a decision area: buyers have recovered a significant portion of the prior decline, but sellers still have a clearly defined zone in which to defend the broader downtrend.
The moving-average ribbon on the daily chart has turned upward with the recovery, but the report does not provide exact moving-average values or a confirmed crossover. The position and slope of those averages should therefore be treated as visual context rather than a numerical signal. Momentum is improving with the rebound, although the absence of a recorded structure event argues against treating that improvement as a confirmed trend reversal.
The most recent candles show hesitation near the upper part of the recovery. Price has reached the resistance region and then failed to extend immediately, leaving a mixed buyer-versus-seller picture. Buyers retain the short-term recovery while price holds above 77464.66; sellers retain control of the larger structure while the market remains beneath 81426.29–82844.58.
Conditional scenarios
Bullish continuation scenario
If daily price establishes acceptance above 81426.29–82844.58, the recovery would gain stronger technical confirmation. The first implication would be a challenge of the broader weekly resistance zone at 94705.30–97971.19. This scenario would be weakened if price returned below 77464.66 after failing to hold the breakout area.
Bearish rejection scenario
If price is rejected from 81426.29–82844.58 and then loses the 77464.66 Fibonacci reference, the upward sub-trend would be under pressure. Attention would then return to the lower Fibonacci references at 73241.18, 70274.69, and 67308.19. This bearish interpretation would be challenged by sustained acceptance above the daily resistance zone.
Range and failed-break scenario
Price may continue to oscillate between the 77464.66 reference and 81426.29–82844.58 without producing a confirmed structure event. A false break in either direction would increase the importance of the next daily close: recovery back below 77464.66 would favour sellers, while a sustained close above 82844.58 would favour the bullish case.
What to monitor
- Resistance: 81426.29–82844.58, followed by weekly supply at 94705.30–97971.19.
- Fibonacci pivot: 77464.66, with the current retracement ratio at 0.825.
- Lower references: 73241.18, 70274.69, 67308.19, and 63637.78.
- Structural support: daily support at 57704.79–58845.82 and weekly support at 59783.75–69241.82.
- Confirmation: a sustained daily close beyond the resistance zone or a decisive loss of 77464.66.
The principal trap is to treat the upward sub-trend as a confirmed reversal before a structure event is recorded. A temporary move above resistance that cannot hold would favour the failed-break interpretation, while a sharp rejection below 77464.66 would signal that sellers are regaining control. The reported ATR values of 2282.06 on the daily frame and 6531.77 on the weekly frame also argue for allowing sufficient room for normal volatility when interpreting breaks.
Summary
- The weekly and daily main trends remain firmly down.
- The upward sub-trend is a recovery, not yet a confirmed reversal.
- 81426.29–82844.58 is the central resistance zone.
- 77464.66 is the key Fibonacci reference beneath the current price.
- A break above resistance would improve the bullish case; a loss of 77464.66 would strengthen the bearish case.
The single most important issue is whether price can sustain acceptance above 81426.29–82844.58 or returns below 77464.66.
#BTCUSD #BitcoinAnalysis #PriceAction #DowTheory #TechnicalAnalysis
Meta description: BTCUSD remains in a firm downtrend as a daily recovery tests 81426.29–82844.58 resistance and 77464.66 Fibonacci support.
This article is technical analysis and reference information only, not investment advice. Markets carry risk, and readers are responsible for their own decisions.