
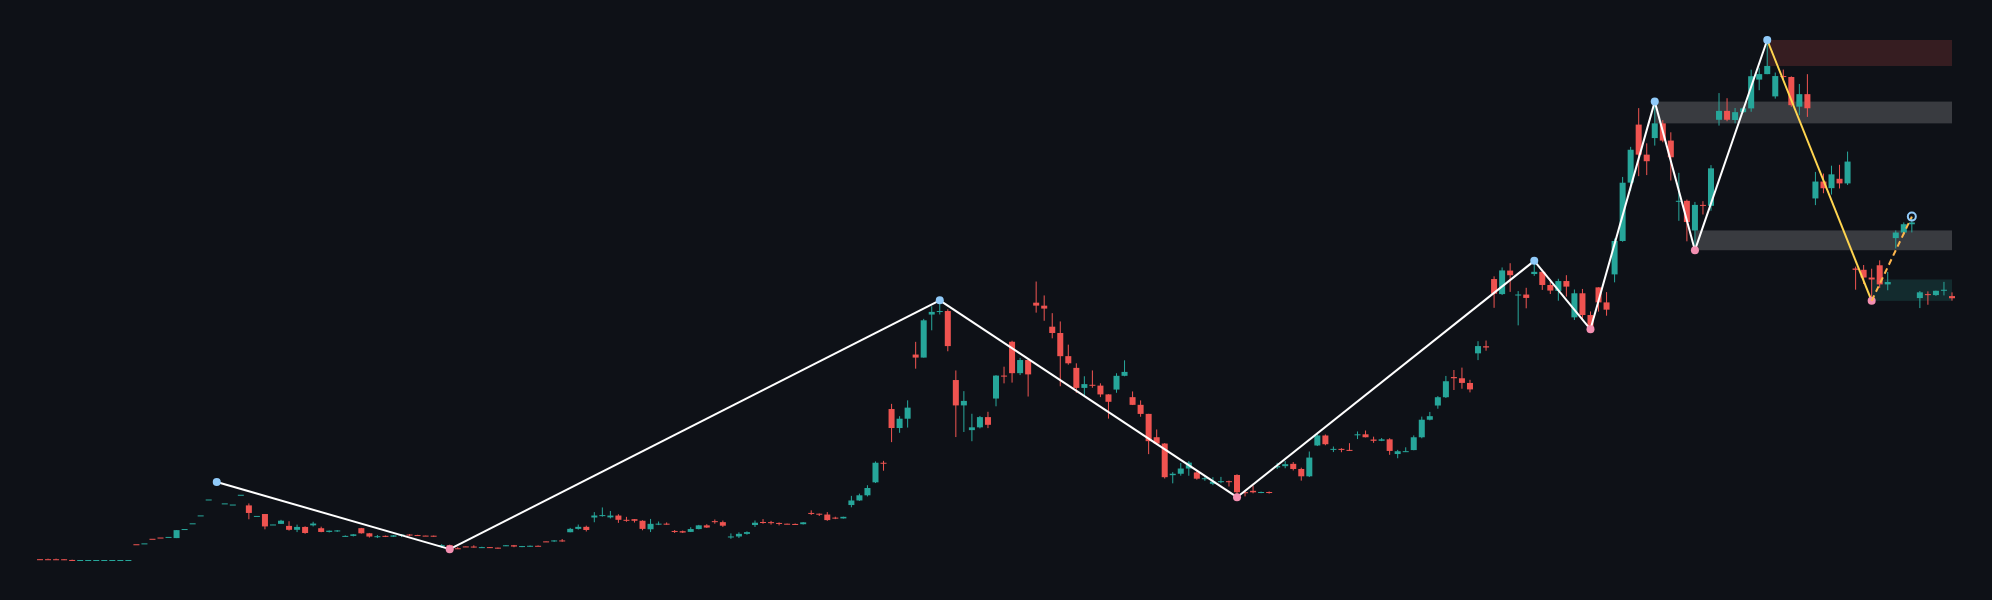
BTCUSD is balancing between a firm higher-timeframe sideways structure and a firm daily downtrend. The latest daily close is 64472.33, while the weekly context frame shows a last closed price of 63020.22. The notable feature is the mismatch between the daily sub-trend, which is up, and the broader daily trend, which remains down as price trades near the weekly support zone at 62409.68 – 67488.06.
Higher-timeframe context
The weekly trend is sideways and firm, with a sideways sub-trend and no confirmed structure event. The most recent confirmed weekly swing is a low at 62409.68, placing the current market near an important demand area rather than in clear open space.
The principal weekly support zone is 62409.68 – 67488.06. A deeper broken-retest support zone is marked at 104703.29 – 109879.73, while the broken-retest resistance zone is 74471.48 – 79173.64. The higher resistance zone is 118374.30 – 124563.72. Weekly ATR is 7477.78, indicating that the broader frame allows substantial movement around these areas.
Because the weekly report provides no weekly Fibonacci readings, the active weekly retracement cannot be determined from the report. The higher-timeframe conclusion is therefore balanced: the support zone can permit a recovery, but the absence of a confirmed weekly structure event does not establish a new bullish trend.
Main-frame structure
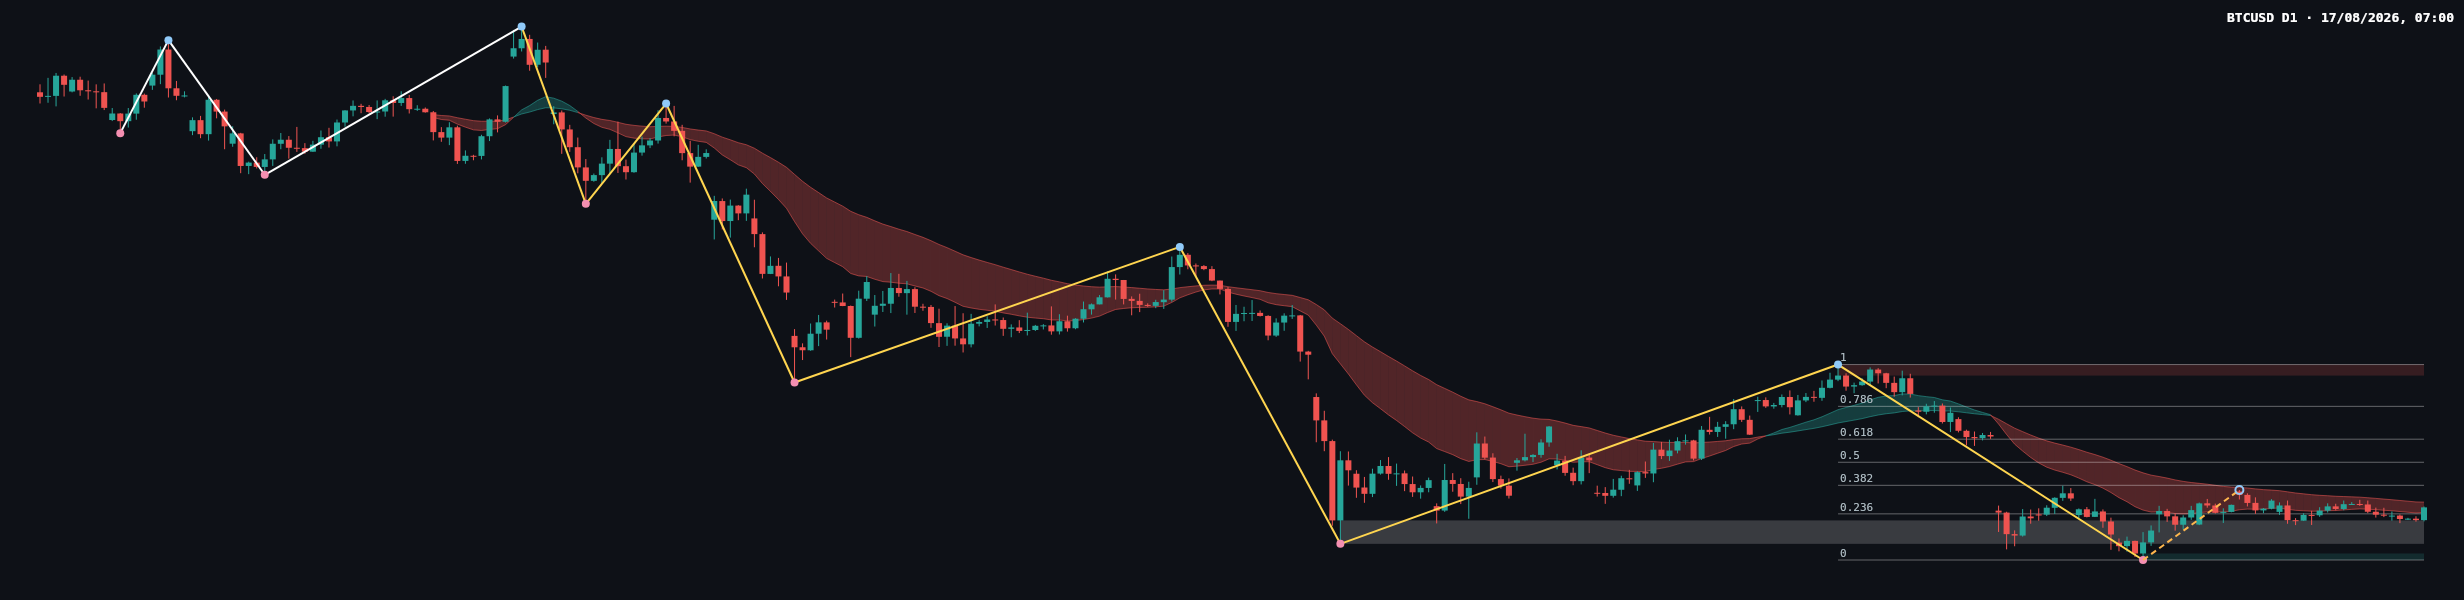
The daily main trend is down and firm, while the sub-trend is up. This is a counter-trend recovery within a broader bearish structure unless price can produce a confirmed change in structure. The report identifies no daily structure event.
The latest daily close at 64472.33 is above the broken-retest resistance zone at 59783.75 – 62793.85. That area is now important for assessing whether the recovery is being accepted above former resistance or whether the move is losing support. The nearest stated daily resistance is 81426.29 – 82844.58, and the main support zone is 57704.79 – 58541.32. The most recent confirmed daily swing is a low at 57704.79.
Daily ATR is 1356.03. The chart shows the moving-average envelope above and around price, consistent with a market still negotiating a bearish trend rather than displaying a clean, established upside impulse. The available report does not provide EMA values, so exact EMA positions, slopes, spacing, and crossovers are not determinable from the report.
Key levels and Fibonacci map
- 64472.33: latest daily closing price.
- 62409.68 – 67488.06: weekly support zone and the main higher-timeframe area currently framing price.
- 59783.75 – 62793.85: daily broken-retest resistance zone, now a key boundary beneath the latest close.
- 81426.29 – 82844.58: daily resistance zone and the upper endpoint of the latest completed Dow leg.
- 57704.79 – 58541.32: daily support zone.
The latest completed daily Dow leg has Fibonacci readings at 0 equal to 57704.79, 0.236 equal to 63637.78, 0.382 equal to 67308.19, 0.5 equal to 70274.69, 0.618 equal to 73241.18, 0.786 equal to 77464.66, and 1 equal to 82844.58. The current retracement ratio is 0.269.
Price is above the 0.236 Fibonacci level at 63637.78 but below 0.382 at 67308.19. This places the recovery in the lower part of the retracement map. Acceptance above 67308.19 would improve the case for continuation toward the next Fibonacci areas, while rejection below that level would keep the move vulnerable to a return toward the lower support references.
Scenarios
Bullish recovery scenario
If price holds above the weekly support zone at 62409.68 – 67488.06 and establishes acceptance above the 0.382 Fibonacci level at 67308.19, the daily sub-trend could extend upward. The next resistance references would be the 0.5 level at 70274.69, the 0.618 level at 73241.18, and the weekly broken-retest resistance zone at 74471.48 – 79173.64. This scenario would be invalidated by sustained failure back below the weekly support area, with the deeper daily support zone at 57704.79 – 58541.32 becoming relevant.
Bearish continuation scenario
If price is rejected in the area between the current close and 67308.19, then loses the weekly support zone at 62409.68 – 67488.06, the daily recovery would be weakened. A return through the broken-retest zone at 59783.75 – 62793.85 would reinforce the idea that former resistance is again acting as a ceiling. The principal downside reference would be 57704.79 – 58541.32. This scenario would be invalidated by sustained acceptance above 67308.19 and improving progress toward 70274.69.
Range and failed-break scenario
Price may continue to rotate between the weekly support zone at 62409.68 – 67488.06 and the higher Fibonacci references without producing a confirmed structure event. A false break above 67308.19 followed by a return into the support zone would favor continued range conditions. Conversely, a brief move below support that quickly reclaims the zone would weaken the bearish continuation case. The range interpretation is invalidated by sustained acceptance beyond either boundary and follow-through toward the next stated resistance or support area.
Recent price action
The daily chart shows a recovery from the confirmed swing low at 57704.79, followed by consolidation beneath the higher resistance zone at 81426.29 – 82844.58. The latest visible candles appear comparatively compressed, with alternating bullish and bearish bodies near the lower Fibonacci area. That pattern suggests reduced directional conviction rather than a decisive breakout.
The buyer case is supported by the daily sub-trend being up and by price remaining above 63637.78. The seller case is supported by the firm daily downtrend and the fact that price remains below 67308.19, with the broader resistance zone still distant at 81426.29 – 82844.58. Exact candle classifications, volume confirmation, and EMA readings are not determinable from the deterministic report.
Session focus and conclusion
- Watch whether price remains above 63637.78 and the weekly support area at 62409.68 – 67488.06.
- Monitor 67308.19 as the next Fibonacci decision level, followed by 70274.69 and 73241.18 if recovery continues.
- On weakness, the broken-retest zone at 59783.75 – 62793.85 and the daily support at 57704.79 – 58541.32 are the principal downside references.
- Confirmation would require a sustained close beyond the relevant boundary and a successful retest; a brief wick through a level would not by itself confirm direction.
- No scheduled news, volume data, or exact session event window is provided in the report, so fundamental and session-specific catalysts are not determinable here.
Overall, the daily bias is cautiously constructive while price holds the weekly support framework, but the firm daily downtrend keeps bearish continuation in play. The most important question is whether price can establish acceptance above 67308.19 or instead return below 63637.78 and the surrounding support zone.
Summary
- Weekly structure is sideways and firm, with the most recent confirmed low at 62409.68.
- Daily trend remains down and firm, despite an upward sub-trend from 57704.79.
- The current close at 64472.33 is above 63637.78 but below 67308.19.
- Acceptance above 67308.19 would improve the recovery case; rejection and loss of 62409.68 – 67488.06 would favor renewed weakness.
Hashtags: #BTCUSD #Bitcoin #TechnicalAnalysis #PriceAction #DailyAnalysis
Meta description: BTCUSD daily analysis covering weekly context, support, resistance, Fibonacci levels, and conditional bullish and bearish scenarios.
This article is technical analysis and reference information only, not investment advice. Markets carry risk, and readers are responsible for their own decisions.