
BTCUSD closed at 63020.22. The higher-timeframe chart remains sideways, with price positioned inside the weekly 62409.68–67488.06 support zone. On the daily frame, the main trend is down while the sub-trend is up, creating a developing recovery inside a broader bearish structure. The most important short-term question is whether price can sustain trade above the daily broken-retest zone at 59783.75–62793.85 and challenge the Fibonacci area beginning at 63637.78.
Higher-timeframe context
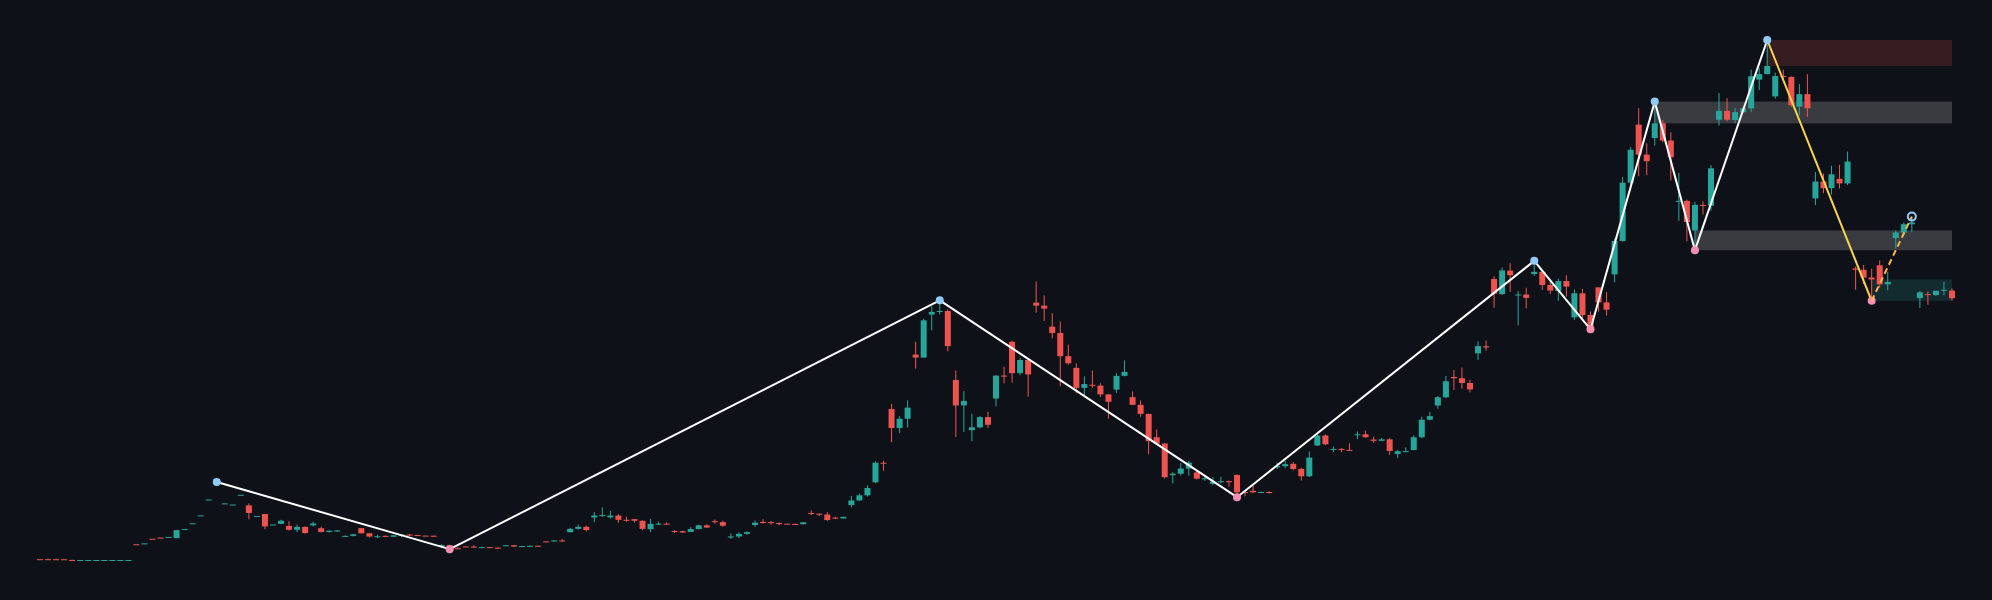
The weekly trend is sideways and firm, with the sub-trend also sideways. No confirmed weekly structure event is reported. The most recent confirmed weekly swing is a low at 62409.68, which places the latest close at 63020.22 within the weekly support zone of 62409.68–67488.06.
This positioning gives the market room for a bullish recovery, but it does not yet establish a new weekly uptrend. The wider weekly resistance zone at 118374.30–124563.72 remains distant, while the broken-retest zones at 104703.29–109879.73 and 74471.48–79173.64 identify former structural areas that could matter if price develops a sustained advance. Weekly ATR is 7499.51, indicating that the broader frame allows for substantial movement around the current support area.
The weekly chart does not provide a current Fibonacci interaction in the supplied report. The practical higher-timeframe conclusion is therefore conditional: holding the weekly support zone keeps recovery potential open, while sustained weakness beneath 62409.68 would undermine that support interpretation.
Main-frame structure
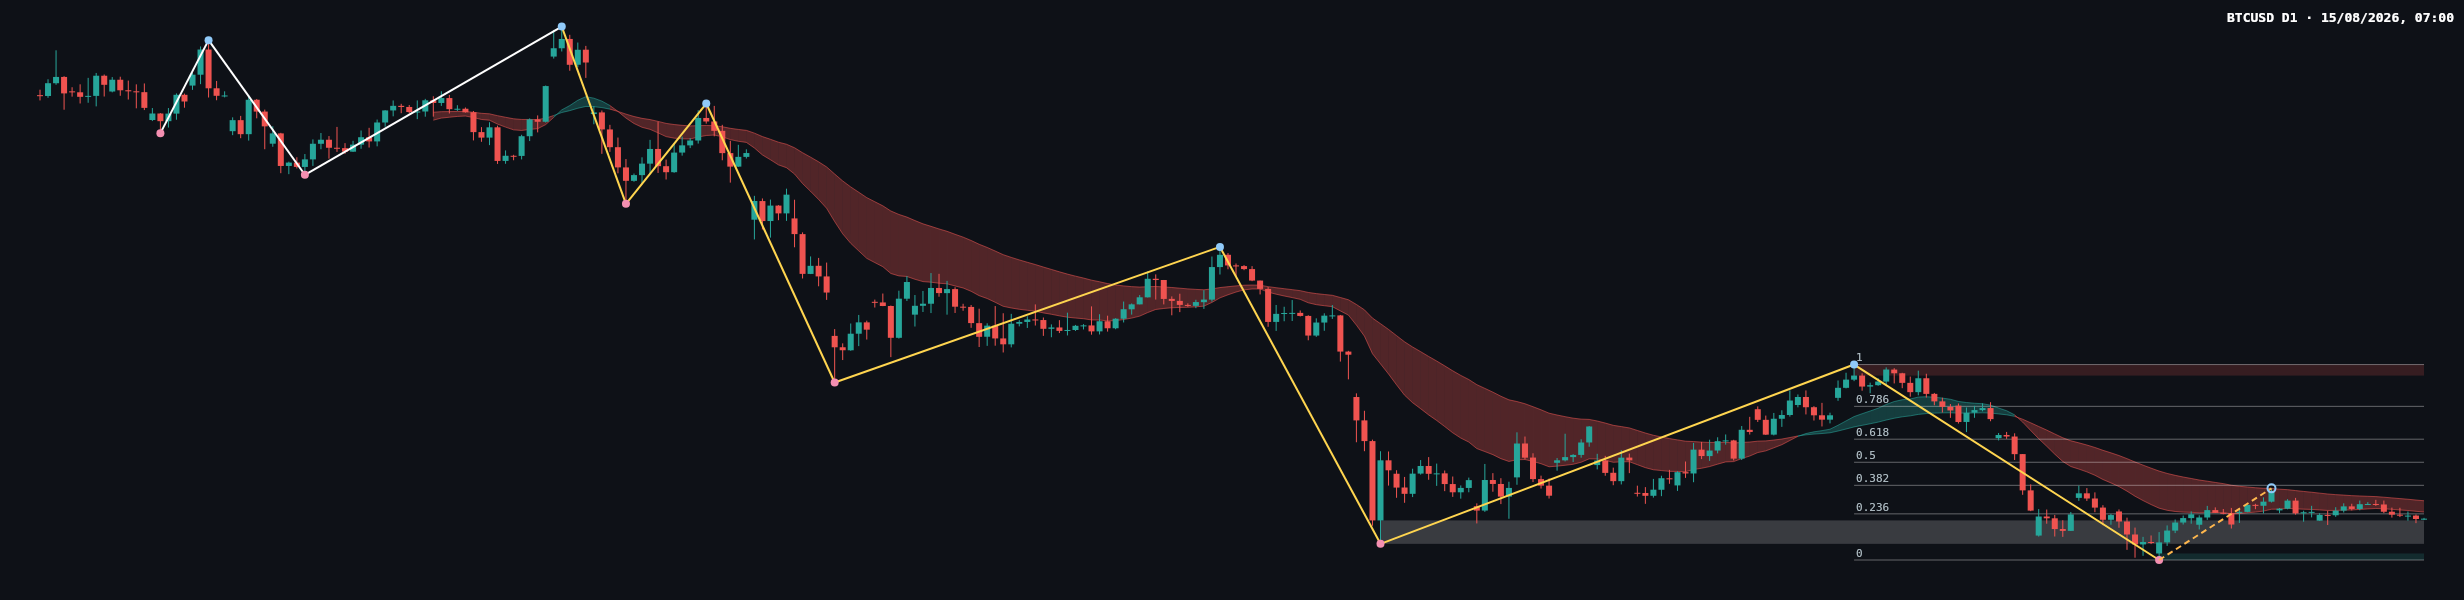
The daily main trend is down firmly, but the sub-trend is up. This is a misalignment rather than a confirmed reversal: the upward movement can be read as a counter-trend recovery unless price produces a new confirmed structure event. No daily structure event is reported, and the most recent confirmed daily swing is a low at 57704.79.
Price at 63020.22 is just above the daily broken-retest resistance zone at 59783.75–62793.85. That area can therefore act as a decision zone. Acceptance above it would improve the recovery structure, while a return into the zone followed by rejection would preserve the dominant daily bearish trend. The primary daily resistance zone above is 81426.29–82844.58, while daily support is located at 57704.79–58541.32. Daily ATR is 1352.72.
The annotated moving-average envelope remains relevant as a trend filter, but exact moving-average values are not included in the deterministic report. The chart therefore supports a directional reading from price structure and zones, not a precise moving-average measurement.
Key levels and Fibonacci map
| Area | Level or zone | Technical role |
|---|---|---|
| Current close | 63020.22 | Inside the weekly support area and just above daily broken-retest resistance |
| Near Fibonacci reference | 63637.78 | Fibonacci 0.236 level |
| Next Fibonacci reference | 67308.19 | Fibonacci 0.382 level |
| Weekly support | 62409.68–67488.06 | Current higher-timeframe support zone |
| Daily broken-retest zone | 59783.75–62793.85 | Immediate test of acceptance or rejection |
| Daily support | 57704.79–58541.32 | Lower structural support |
| Daily resistance | 81426.29–82844.58 | Major upside structural barrier |
The latest completed daily Dow leg maps Fibonacci levels from 57704.79 to 82844.58. The reported current retracement ratio is 0.211, below the 0.236 level at 63637.78. This makes 63637.78 the first meaningful reference above the current close. Further Fibonacci levels are 67308.19 at 0.382, 70274.69 at 0.5, 73241.18 at 0.618, and 77464.66 at 0.786.
Recent daily price action
The recent candles on the daily chart show a recovery from the area around the confirmed low at 57704.79, followed by a relatively narrow consolidation near 63020.22. The latest cluster does not display a decisive expansion away from the daily broken-retest zone at 59783.75–62793.85. This suggests that buyers have defended the lower structure, but sellers remain active around the current Fibonacci reference at 63637.78.
The closing candle should therefore be read in relation to 62793.85 and 63637.78, rather than in isolation. A close that holds above the former zone and progresses through the latter would show improving buyer control. Conversely, a close back inside 59783.75–62793.85 would indicate that the recovery has not yet converted the broken-retest area into reliable support.
Volume and momentum data are not included in the deterministic report, so confirmation from those measures is not determinable here. Price structure remains the primary evidence.
Conditional scenarios
Primary scenario: recovery remains constructive above the daily zone
If BTCUSD sustains trade above 62793.85 and pushes through the Fibonacci reference at 63637.78, the recovery could extend toward 67308.19. The weekly support zone at 62409.68–67488.06 would remain the structural backdrop. This scenario would be invalidated by a sustained return below 59783.75, which would place price back inside the daily broken-retest area.
Secondary scenario: range-bound consolidation
If price remains between the daily broken-retest zone at 59783.75–62793.85 and the Fibonacci reference at 63637.78, the market may continue consolidating rather than confirming either direction. This would be consistent with the weekly sideways trend and the absence of a reported daily structure event. The range interpretation would weaken if price establishes acceptance above 63637.78 or loses 59783.75.
Risk scenario: renewed bearish pressure
If BTCUSD rejects the area above 62793.85 and breaks beneath 59783.75, sellers could retest the daily support zone at 57704.79–58541.32. A sustained break below 57704.79 would challenge the latest confirmed daily swing low and weaken the current recovery structure. The bearish scenario would be questioned if price reclaims and holds above 63637.78.
Overall, the daily bias is cautiously constructive while price holds above the daily broken-retest zone, but the firm daily downtrend means that recovery strength still requires confirmation above 63637.78.
Key considerations
- Resistance: monitor 63637.78, followed by 67308.19 and the daily resistance zone at 81426.29–82844.58.
- Support: monitor 59783.75–62793.85, then 57704.79–58541.32 and the weekly zone at 62409.68–67488.06.
- Confirmation: bullish continuation would require acceptance above 63637.78; bearish continuation would require sustained trade below 59783.75.
- Traps: false breaks around the daily broken-retest zone could produce reversals before a directional move develops.
- Risk framework: technical zones are observation areas, not order instructions. Volatility, correlation and event risk should be considered before acting on any market view.
No specific news or economic-calendar context was supplied with the report. Traders should independently monitor the dollar, Treasury yields, scheduled macroeconomic releases and geopolitical headlines, since these can affect whether BTCUSD accepts or rejects the levels above.
Summary
- BTCUSD closed at 63020.22 inside the weekly support zone at 62409.68–67488.06.
- The daily trend remains firmly down, although the sub-trend is up from the confirmed low at 57704.79.
- The daily broken-retest zone at 59783.75–62793.85 is the immediate structural decision area.
- A move through Fibonacci 0.236 at 63637.78 would strengthen the recovery case toward 67308.19.
- A loss of 59783.75 would expose the daily support zone at 57704.79–58541.32.
The single most important consideration is whether price can sustain acceptance above 63637.78 or instead returns below 59783.75.
#BTCUSD #Bitcoin #TechnicalAnalysis #PriceAction #CryptoMarkets
Meta description: BTCUSD analysis covering weekly support, daily structure, Fibonacci levels and conditional bullish and bearish scenarios.
This article is technical analysis and reference information only, not investment advice. Markets carry risk, and readers are responsible for their own decisions.