
BTCUSD is trading at 64717.40 on the daily frame, while the latest weekly close is 61490.17. The higher timeframe remains sideways, but the daily trend is still down despite an upward sub-trend. Price is currently above the daily broken-retest resistance zone at 59783.75 – 62793.85, above Fibonacci 0.236 at 63637.78, and below Fibonacci 0.382 at 67308.19. This leaves the market at a conditional decision area rather than a confirmed reversal.
Higher-timeframe context
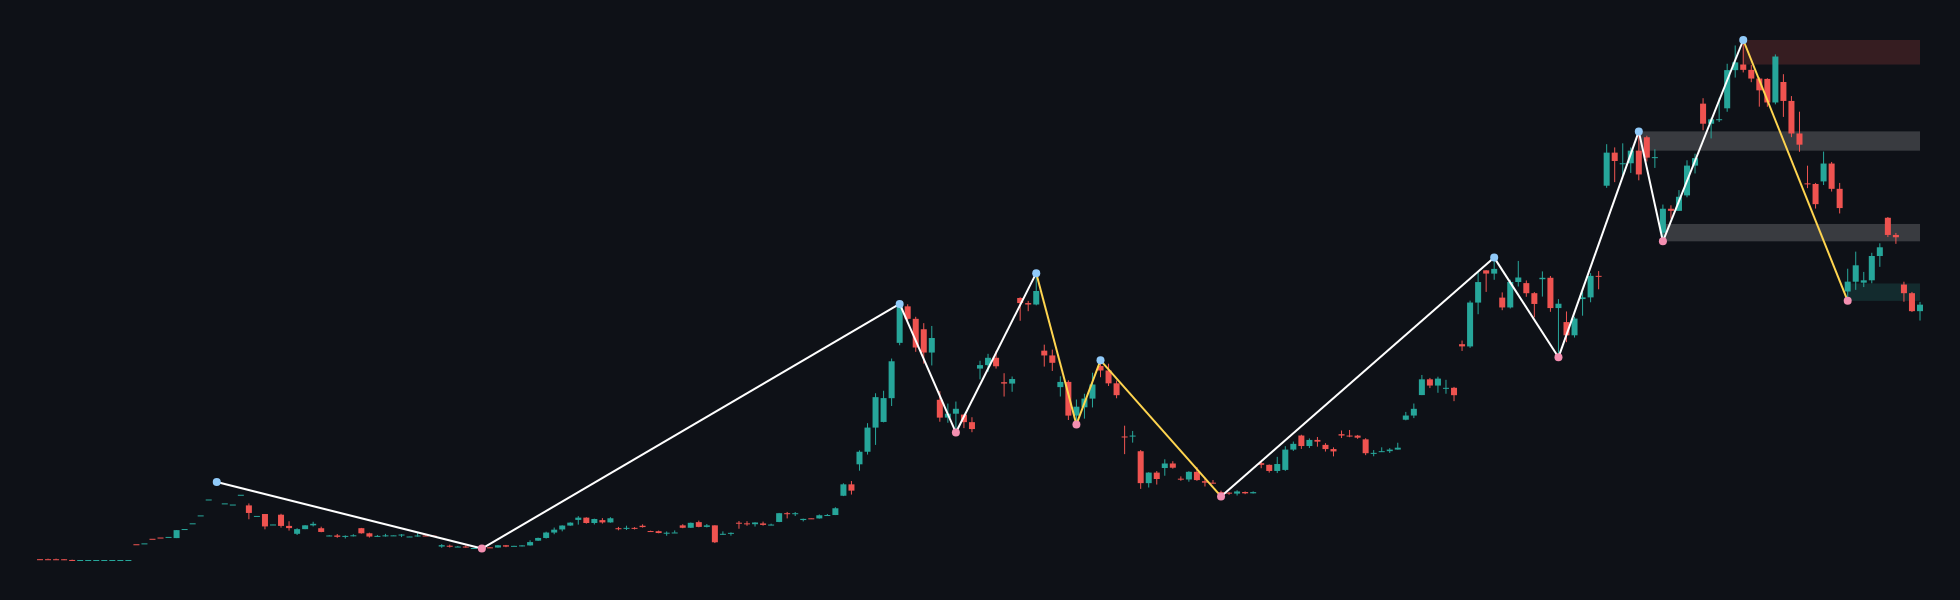
The weekly main trend and sub-trend are both sideways, and the report identifies no current structure event. The most recent confirmed weekly swing is a low at 62409.68, which places the broader structure close to the weekly support zone at 62409.68 – 66537.39.
The weekly chart also shows a higher resistance zone at 118723.58 – 124563.72. A former support area at 98195.04 – 102782.35 is marked as a broken-retest zone, while 76590.80 – 80718.51 is marked as a former resistance zone that has also been broken and retested. These zones frame a market that has experienced substantial directional movement but currently lacks a fresh weekly structure break.
The weekly ATR is 8255.43, indicating a broad higher-timeframe volatility envelope. With the weekly close at 61490.17, the principal nearby reference is the support zone at 62409.68 – 66537.39. A sustained move above that area would improve the weekly recovery picture, while renewed acceptance below it would keep the broader structure vulnerable.
Main-frame structure
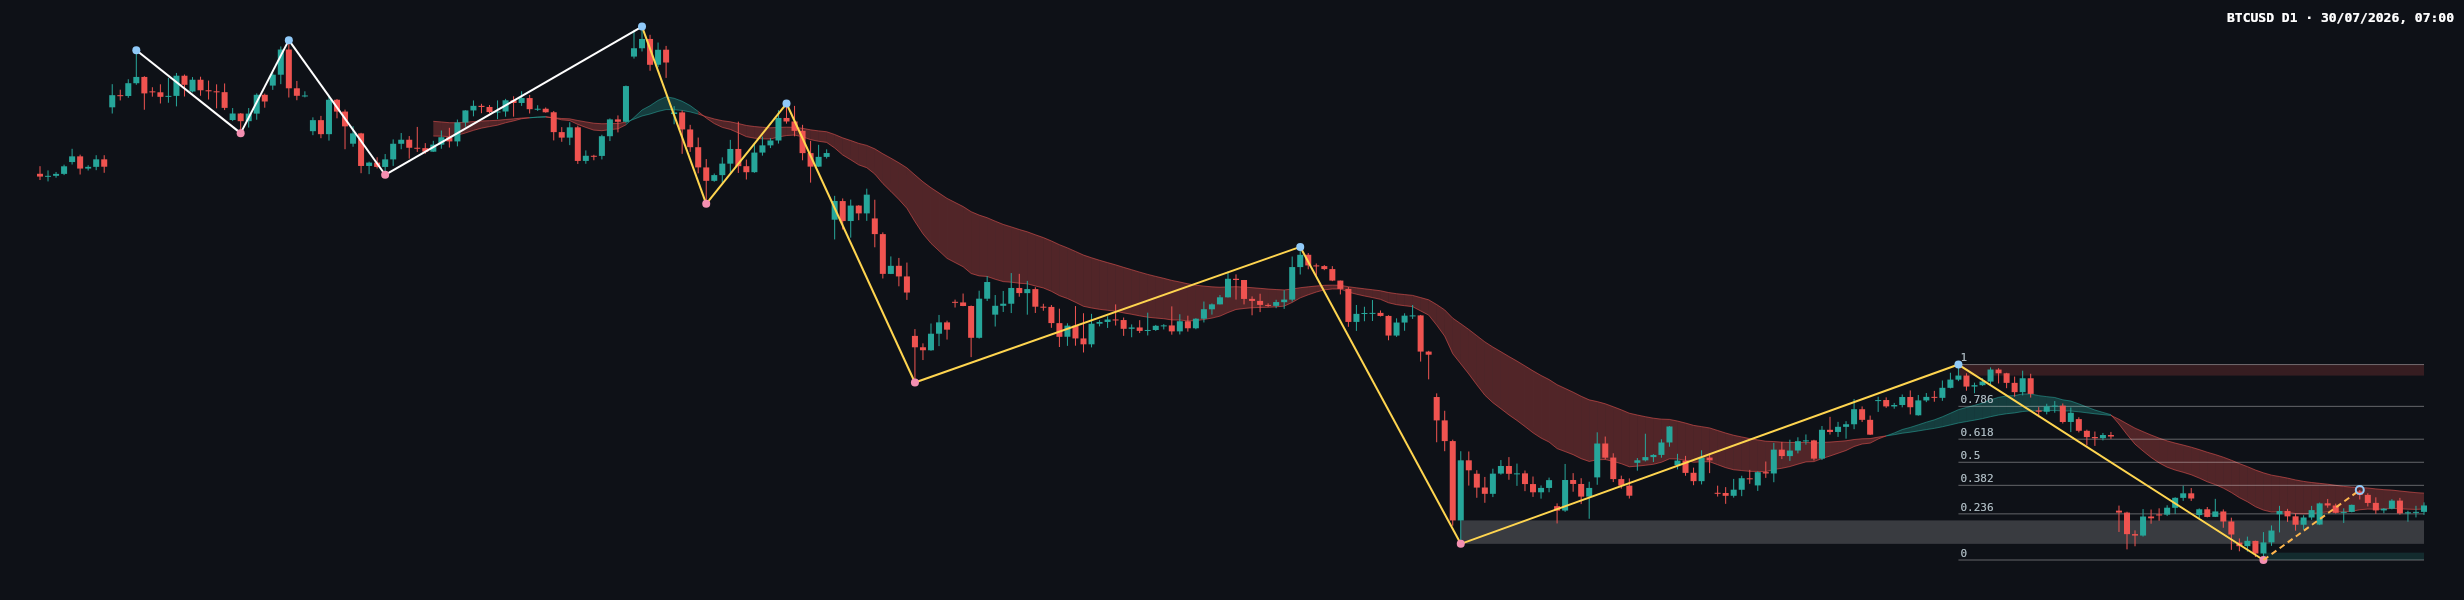
On the daily frame, the main trend is down and the sub-trend is up. That mismatch is important: the recent advance may be a counter-trend recovery within a larger decline, although continued acceptance above former resistance would begin to challenge that interpretation.
The latest daily close at 64717.40 is above the broken-retest resistance zone at 59783.75 – 62793.85. It is also above Fibonacci 0.236 at 63637.78, but remains below 0.382 at 67308.19. The current retracement ratio is 0.279, showing that the recovery has moved beyond the first retracement reference without yet reaching the next major level.
The daily chart shows price interacting with a broad moving-average ribbon. The ribbon has previously acted as overhead pressure during the decline, so the reaction around 67308.19 is more important than the recovery alone. The daily ATR is 1878.84, which argues for allowing room for normal movement around the marked levels rather than treating every intraday fluctuation as a structural signal.
Key levels
| Reference | Level or zone | Interpretation |
|---|---|---|
| Current daily close | 64717.40 | Current reference point on the main frame |
| Weekly close | 61490.17 | Higher-timeframe closing reference |
| Daily broken-retest resistance | 59783.75 – 62793.85 | Former resistance now being held above |
| Fibonacci support reference | 63637.78 | Fibonacci 0.236 |
| Fibonacci resistance reference | 67308.19 | Fibonacci 0.382 |
| Higher daily resistance | 81426.29 – 82844.58 | Major upside zone |
| Daily support | 57704.79 – 58644.21 | Major downside zone |
The remaining Fibonacci references are 70274.69 at 0.5, 73241.18 at 0.618, 77464.66 at 0.786, and 82844.58 at 1. They become relevant only if the recovery extends beyond the current resistance area.
Scenarios
Bullish continuation
If daily price establishes acceptance above 67308.19, the upward sub-trend would have a stronger technical basis. The next Fibonacci references would be 70274.69, 73241.18, 77464.66, and ultimately the resistance zone at 81426.29 – 82844.58. Invalidation for this scenario would be a failure back below 63637.78, particularly if that loss is followed by renewed trading inside 59783.75 – 62793.85.
Bearish continuation
If price loses 63637.78 and cannot recover it, the recent advance would look increasingly like a retracement within the firm daily downtrend. A return into 59783.75 – 62793.85 would test whether the broken-retest zone can continue to act as support. A deeper bearish path would bring the support zone at 57704.79 – 58644.21 into focus. Invalidation for this scenario would be sustained acceptance above 67308.19.
Range and failed-break scenario
Price may remain contained between 63637.78 and 67308.19 while buyers and sellers test the nearby Fibonacci references. Repeated rejection near 67308.19 would preserve the broader bearish structure, while repeated defense of 63637.78 would keep the daily recovery alive. This range scenario is invalidated by a clear daily acceptance outside those boundaries: above 67308.19 for expansion higher, or below 63637.78 for renewed downside pressure.
How to read the latest price action
The latest candles on the daily chart show a recovery from the lower support region followed by hesitation beneath the overhead ribbon and the marked resistance area. The most recent price action is compact relative to the preceding directional swings, suggesting a contest rather than decisive control. Buyers have defended the recovery above 63637.78, but sellers remain active before 67308.19.
There is no reported daily structure event, so the chart does not yet confirm a new Dow reversal. The practical distinction is between a close that holds above 67308.19 and a close that falls back below 63637.78. Until one of those conditions occurs, the evidence favors conditional range analysis rather than a firm directional conclusion.
Closing view
- The weekly structure is sideways, with the latest confirmed swing low at 62409.68.
- The daily main trend remains down, although the sub-trend is up.
- 63637.78 is the immediate Fibonacci support reference, while 67308.19 is the next Fibonacci resistance reference.
- Holding above 59783.75 – 62793.85 supports the recovery case; losing 63637.78 would weaken it.
- A sustained move above 67308.19 would open the higher Fibonacci references and the zone at 81426.29 – 82844.58.
The single most important thing to monitor is whether daily price is accepted above 67308.19 or rejected back below 63637.78.
Hashtags: #BTCUSD #Bitcoin #PriceAction #DowTheory #TechnicalAnalysis
Meta description: BTCUSD analysis: weekly range, daily downtrend, and the key Fibonacci decision area between 63637.78 and 67308.19.
This article is technical analysis and reference information only, not investment advice. Markets carry risk, and readers are responsible for their own decisions.