
XAU/USD retains a firm uptrend on the weekly and daily frames, but both show a downward sub-trend. The daily close of 4190.617 is within the 4168.534–4203.224 broken-retest support zone, so whether price holds or loses this area is the immediate focus.
Higher-timeframe context
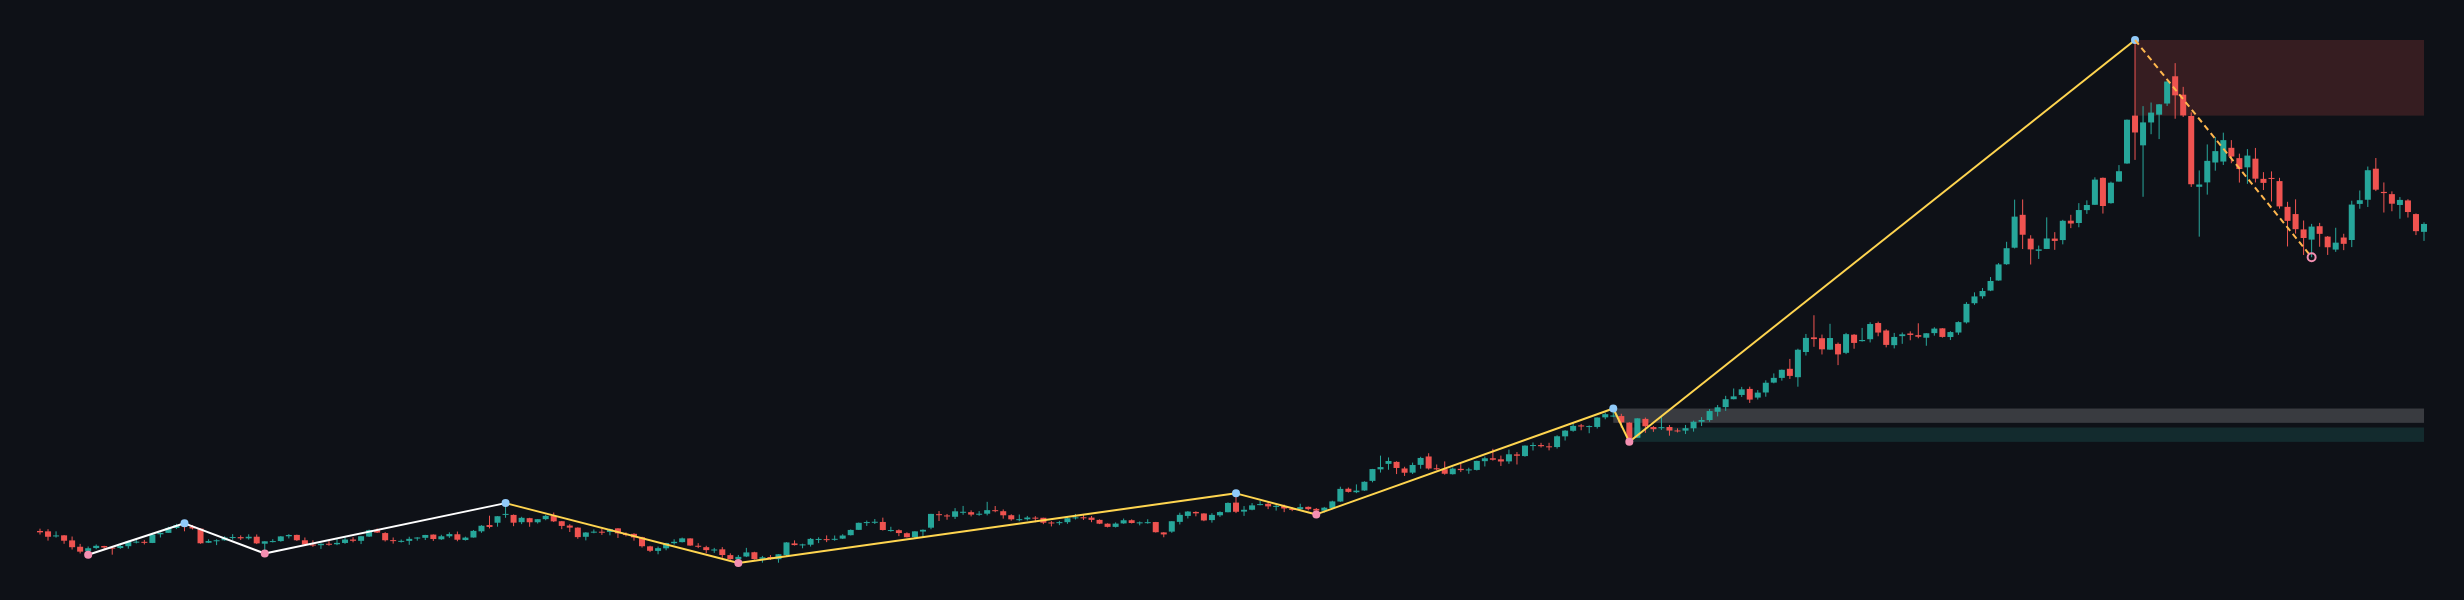
The weekly trend is classified as up and firm, while the sub-trend is down. No structure event is reported, and the most recent confirmed swing is a high at 5595.362. The weekly close is 4195.027, below the resistance zone at 5019.871–5595.362 and above the listed support zones at 2681.333–2790.099 and 2536.779–2645.545. The first is identified as broken-retest support.
This context leaves the broader trend pointing upward, but the falling sub-trend tempers that picture. The weekly data does not specify a Fibonacci level, EMA position, or a fresh structure break, so those cannot be confirmed here.
Main-frame structure
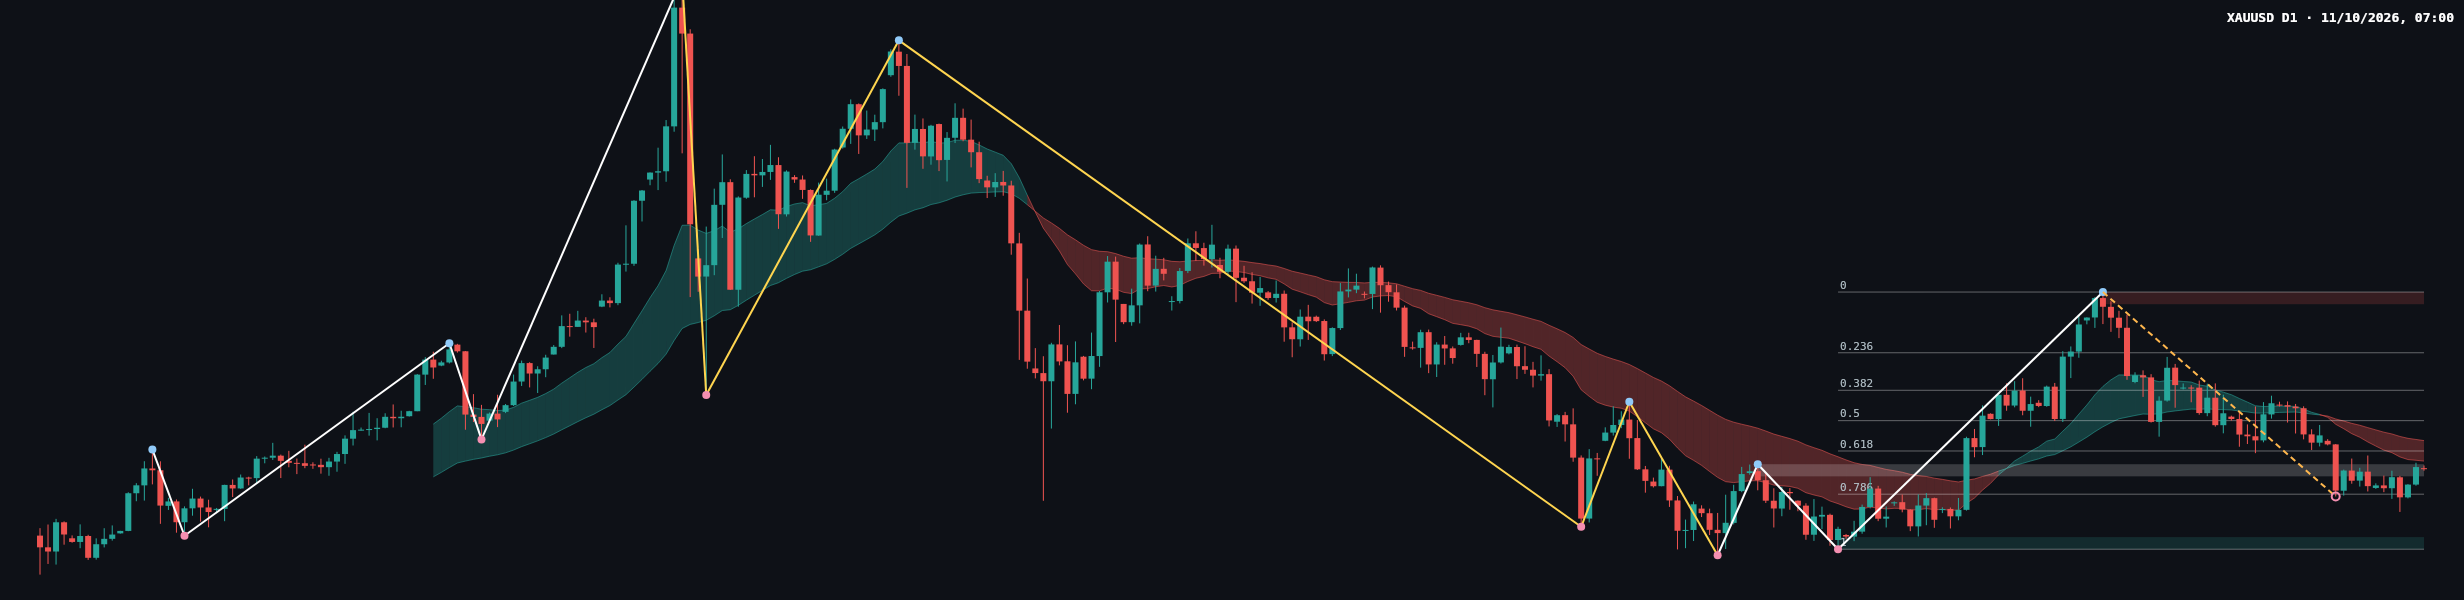
On the daily frame, the main trend is also up and firm, with a down sub-trend. No structure event is reported; the most recent confirmed swing high is 4697.097. The daily close of 4190.617 is inside the broken-retest zone at 4168.534–4203.224, with price below the listed resistance zone at 4662.407–4697.097.
The latest completed Dow leg has Fibonacci references at 4241.198 for 0.618, 4117.264 for 0.786, and 3959.396 for 1. The reported retracement ratio is 0.687, between the 0.618 and 0.786 references. This places the pullback in a meaningful retracement area, but the report does not identify a confirmed reversal.
The supplied data does not give EMA values or a candle-by-candle breakdown, so the latest candle type, wick proportions, and position relative to the EMAs are not determinable from the report. Volume and momentum readings are also not provided. The chart and reported structure support describing a pullback within the broader uptrend, rather than asserting a completed reversal.
Key levels
- 4168.534–4203.224: daily broken-retest support; the current daily close is within this zone.
- 4241.198: daily 0.618 Fibonacci reference.
- 4117.264: daily 0.786 Fibonacci reference.
- 3959.396–3994.086: the next listed daily support zone below.
- 4662.407–4697.097: daily resistance, ending at the most recent confirmed swing high.
- 5019.871–5595.362: weekly resistance zone; the weekly confirmed swing high is at 5595.362.
- 2681.333–2790.099 and 2536.779–2645.545: listed weekly support zones.
Scenarios
- Bullish case: If price recovers above 4203.224 and sustains that area, the broken-retest zone would be reclaimed. The Fibonacci reference at 4241.198 would then be a nearby level to monitor. A move back below 4168.534 would weaken this scenario.
- Bearish case: If price breaks and holds below 4168.534, the current support zone would have failed to contain the pullback. The next Fibonacci reference is 4117.264, with the daily support zone at 3959.396–3994.086 farther below. A recovery above 4203.224 would weaken this case.
- Range case: If price remains within 4168.534–4203.224, neither side has established a clear break of the immediate zone. A sustained move outside it would be needed to make the directional picture clearer.
Overall, the weekly trend provides a bullish backdrop, while the daily down sub-trend keeps downside risk active. The response to the 4168.534–4203.224 zone is the key near-term test; these levels are reference points, not trade instructions.
This analysis is technical reference material, not investment advice. Markets carry risk, and readers are responsible for their own decisions.