
XAU/USD retains a firm upward primary trend on the weekly and daily frames, while the shorter-term structure remains under pressure. The daily close at 4142.421 sits below the 4165.081–4203.224 broken-retest zone and near the 4117.264 Fibonacci reference, making the response around these levels central to the outlook.
Higher-timeframe context
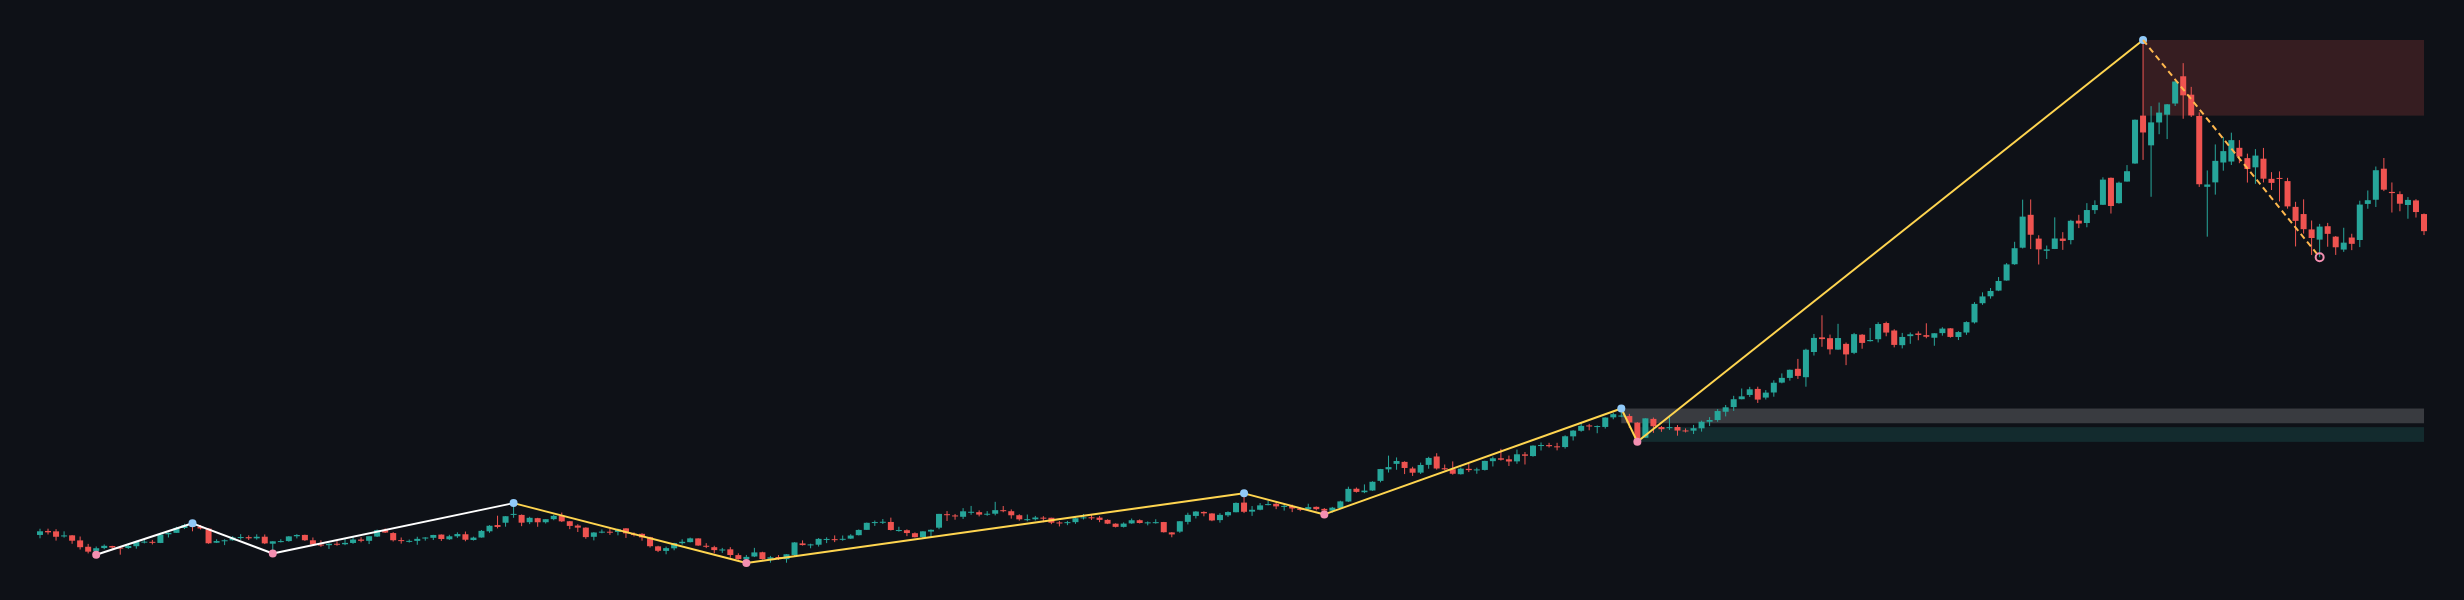
The weekly primary trend is up, with a downward sub-trend and no reported structure event. The most recent confirmed swing high is 5595.362. Weekly price closed at 4140.348, below the marked resistance zone at 5019.871–5595.362. The chart therefore presents a longer-term uptrend alongside a pullback, rather than a confirmed weekly structure break.
The weekly chart marks support at 2678.395–2790.099 and 2536.779–2648.483. These are well below the latest close. The report does not provide weekly Fibonacci levels or EMA readings, so neither is used here.
Main-frame structure
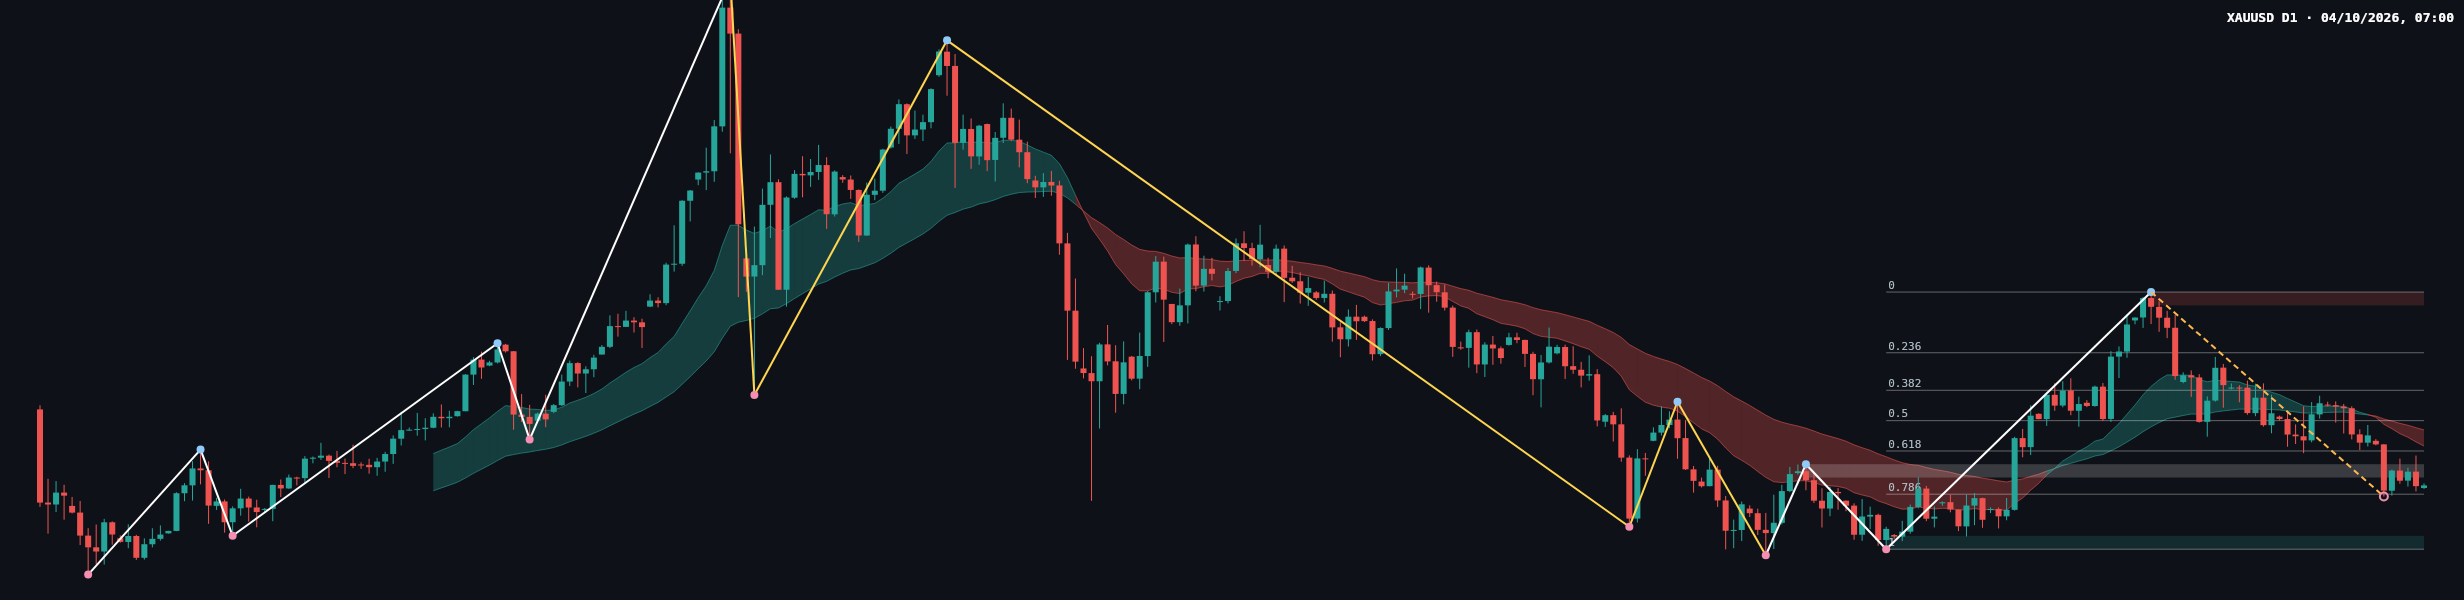
On the daily chart, the primary trend is also up, while the sub-trend is down. No structure event is reported. The latest confirmed swing high is 4697.097, and the marked resistance zone is 4658.954–4697.097. The chart’s declining price action and downward-sloping overlay are consistent with a pullback, but the available data do not establish a confirmed reversal of the primary trend.
The daily close at 4142.421 is just below the broken-retest zone at 4165.081–4203.224. The latest completed Dow leg runs from 4697.097 to 3959.396; its 0.786 retracement is 4117.264, and the current retracement ratio is 0.752. Price is close to that Fibonacci reference, while the chart also shows lower support at 3959.396–3997.539. The provided report does not list EMA values or candle-by-candle data, so precise EMA positioning and a detailed reading of the latest candles are not determinable from the report.
Key levels
- 4165.081–4203.224: broken-retest zone above the daily close; a recovery through this area would improve the near-term picture.
- 4117.264: the daily 0.786 Fibonacci reference, close to current price.
- 3959.396–3997.539: the next marked daily support zone below the Fibonacci reference.
- 4658.954–4697.097: daily resistance and the area of the most recent confirmed swing high.
- 5019.871–5595.362: weekly resistance zone.
Scenarios
- Bullish recovery: If price reclaims and holds above 4165.081–4203.224, that would suggest buyers are regaining ground after the pullback. The next marked daily reference overhead is 4658.954–4697.097. A move back below 4117.264 would weaken this scenario.
- Bearish continuation: If price breaks below 4117.264 and cannot recover it, attention may shift to daily support at 3959.396–3997.539. A sustained move above 4203.224 would weaken this scenario.
- Continued consolidation: If price remains around the area bounded by 4117.264 and 4165.081–4203.224, the chart would continue to show indecision around the Fibonacci reference and broken-retest zone. A clear move beyond either side would challenge this range scenario.
The weekly trend provides a constructive longer-term backdrop, but the daily pullback remains unresolved. The response at 4117.264 and the ability—or failure—to recover 4165.081–4203.224 are the key near-term signals to monitor.
#XAUUSD #Gold #TechnicalAnalysis #PriceAction #MarketOutlook
Meta description: XAU/USD daily analysis: weekly trend remains up as gold tests a key Fibonacci reference below a broken-retest zone.
This article is technical analysis for reference only and is not investment advice. Markets carry risk, and readers are responsible for their own decisions.