
XAU/USD retains an upward primary trend on the weekly and daily frames, while both show a downward sub-trend. The latest daily close is within a broken-retest support zone, making the response around that area central to the near-term outlook.
Higher-timeframe context
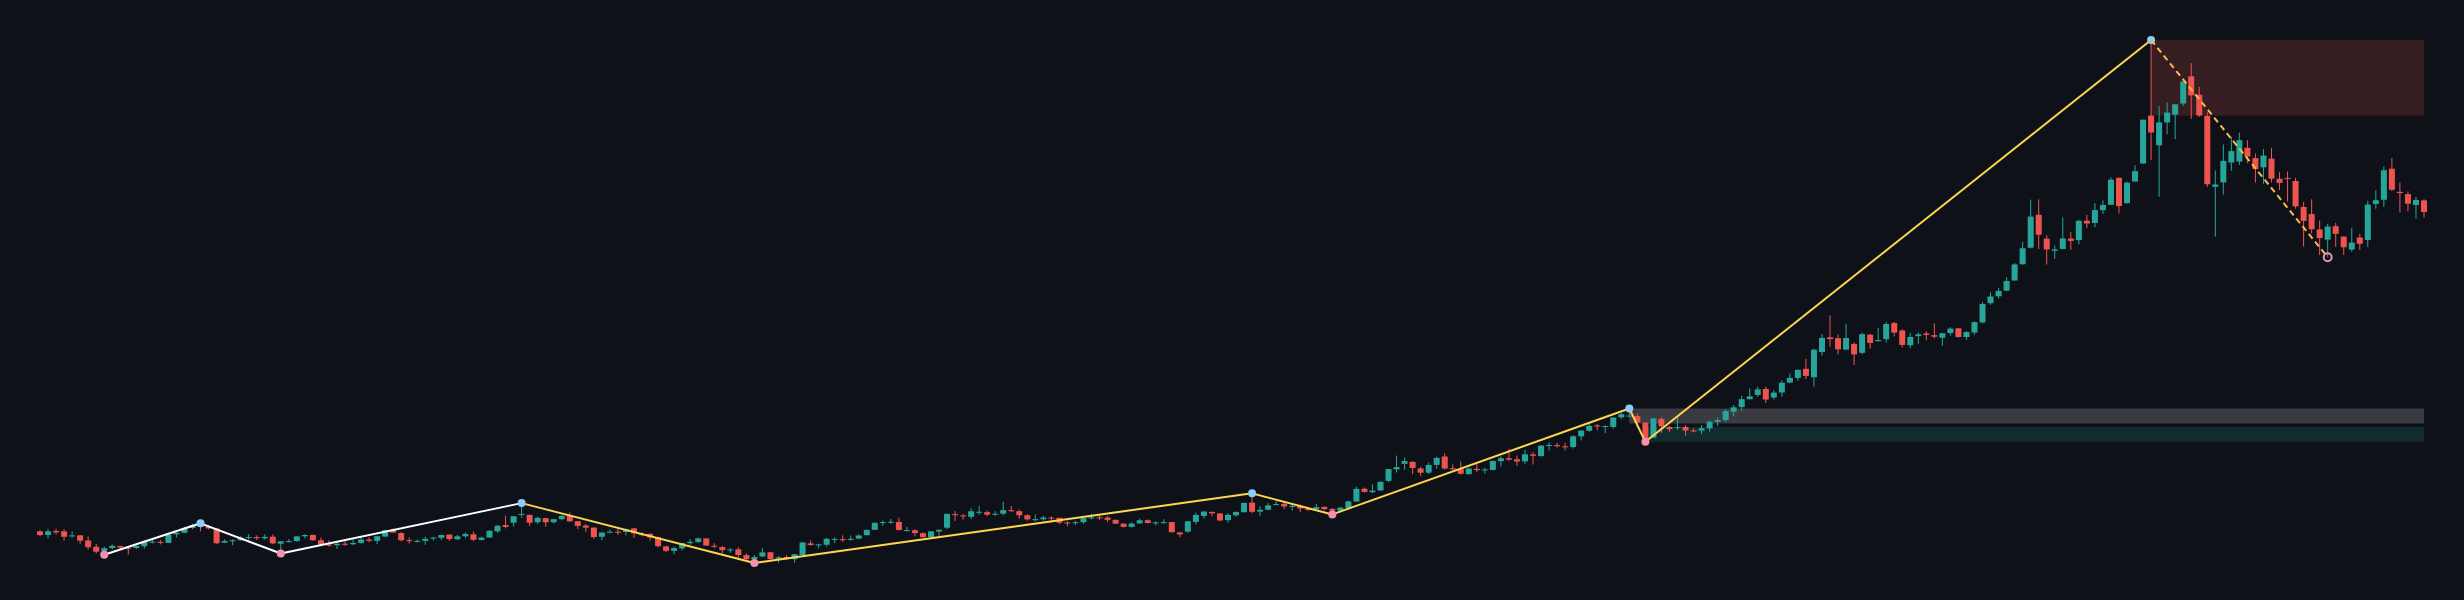
The weekly trend is up and firm, with a down sub-trend and no reported structure event. The most recent confirmed weekly swing is a high at 5595.362. Price remains well below the weekly resistance zone at 5019.871 – 5595.362, while the weekly chart lists support at 2536.779 – 2650.336 and a separate broken-retest support zone at 2676.542 – 2790.099. The weekly last closed price is 4285.936.
The weekly framework therefore still permits a recovery, but the declining sub-trend cautions against treating the broader uptrend as confirmation of an immediate advance. The report does not provide weekly Fibonacci readings or EMA values, so their positions and status cannot be assessed here.
Main-frame structure
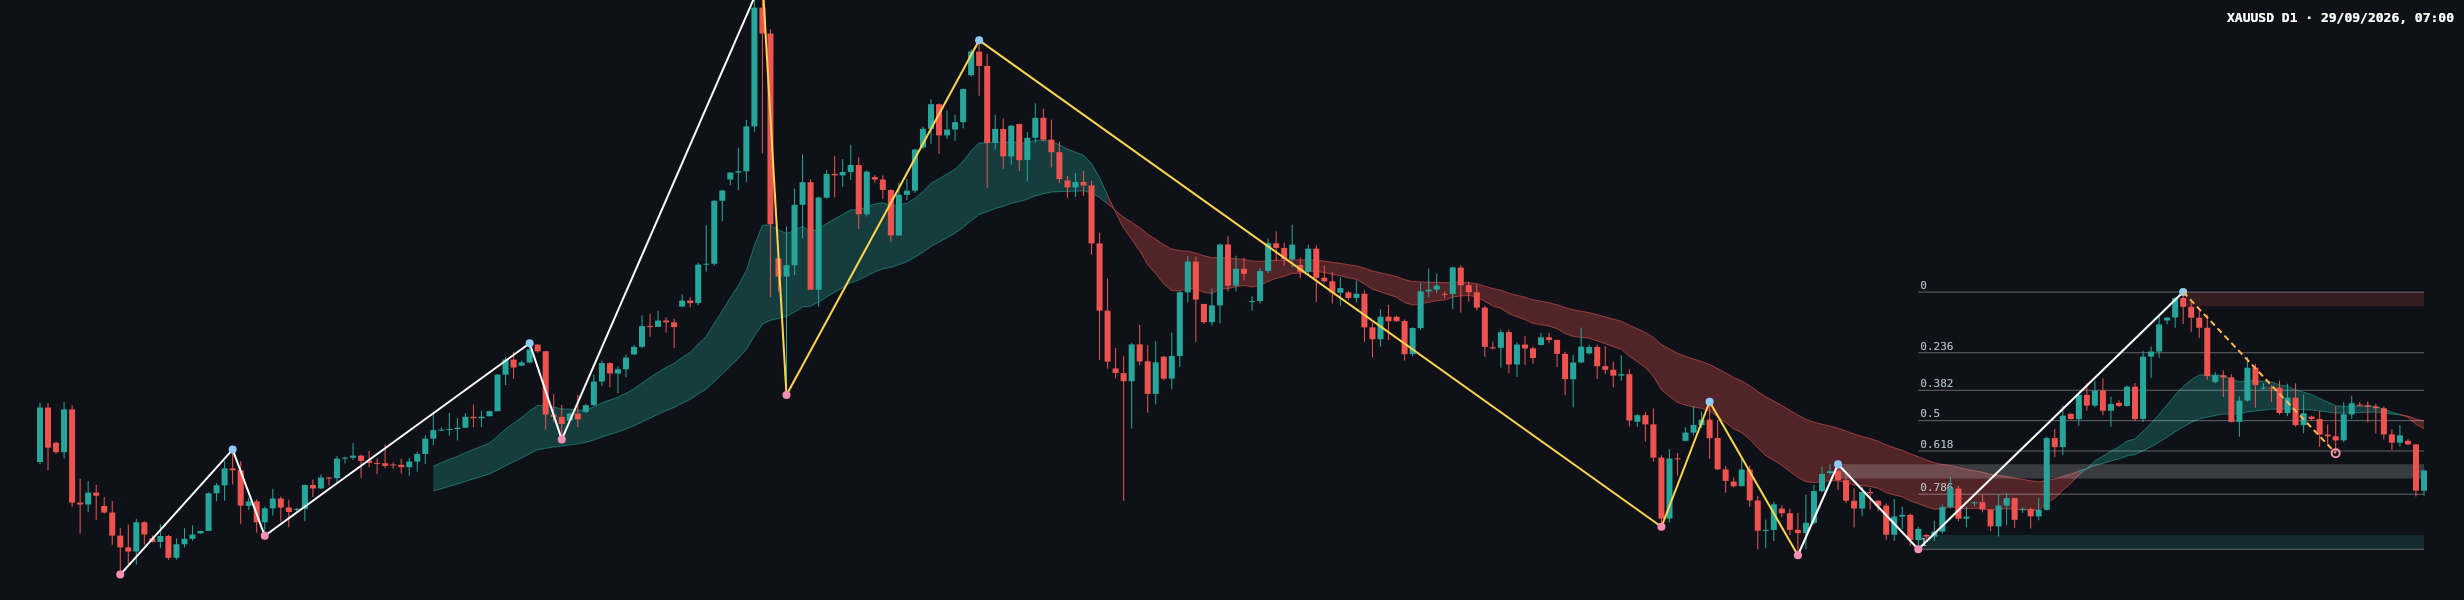
On the daily chart, the main trend is also up and firm, while the sub-trend is down. No structure event is reported, and the most recent confirmed swing high is 4697.097. The last closed price is 4185.099, within the broken-retest support zone at 4162.284 – 4203.224. That overlap makes the zone an important area to monitor, rather than proof by itself that a floor has formed.
The latest visible price action includes a pronounced downward move into the support area, followed by a small upward response at the chart’s right edge. The deterministic report does not provide candle-by-candle OHLC data, so candle types, wick proportions, and comparisons of individual candle ranges cannot be verified. Volume is not reported. EMA values and their exact relationship to the latest close are also unavailable in the data, so no EMA crossover or spacing claim is made.
The daily Fibonacci retracement ratio is 0.694. The latest completed leg’s listed levels place 0.618: 4241.198 above the close and 0.786: 4117.264 below it. The close is between those retracement levels, with the current support zone nearby. This describes location, not confirmation of a reversal.
Key levels
- 4162.284 – 4203.224: daily broken-retest support zone containing the latest daily close.
- 4241.198: Fibonacci 0.618 level; a recovery above it would be an early sign of improving daily momentum.
- 4328.247: Fibonacci 0.5 level, a higher reference if a rebound develops.
- 4415.295 and 4523.000: Fibonacci 0.382 and 0.236 levels, respectively.
- 4656.157 – 4697.097: daily resistance zone, aligned with the most recent confirmed swing high at 4697.097.
- 4117.264: Fibonacci 0.786 level below the current support area.
- 3959.396 – 4000.336: lower daily support zone; 3959.396 is also the Fibonacci 1 level.
Scenarios
Bullish scenario: If price holds the 4162.284 – 4203.224 area and recovers above 4241.198, attention could turn to 4328.247 and then 4415.295. A sustained move below 4117.264 would weaken this recovery scenario.
Bearish scenario: If price fails to hold the support zone and moves below 4117.264, the next listed downside reference is the support zone at 3959.396 – 4000.336. A recovery above 4241.198 would weaken the immediate bearish case, while a move above 4328.247 would provide a stronger challenge to the current downward sub-trend.
Range scenario: If price remains within the current support area but cannot reclaim 4241.198, the chart may continue to reflect unresolved pressure between support and the nearby Fibonacci reference. A decisive move beyond either boundary would make this range interpretation less relevant.
The balance is cautious while the daily sub-trend remains down, but the broader uptrend and current support area leave room for a rebound if buyers can demonstrate a sustained response. These are conditional paths, not forecasts of certainty.
Closing view
The key question is whether the daily broken-retest support zone can contain the pullback. Holding it and reclaiming Fibonacci resistance would improve the recovery case; losing the lower retracement reference would expose the next listed support zone. The report provides no news calendar or session-specific data, so external catalysts and intraday timing are not assessed.
This article is technical market analysis for reference only, not investment advice. Markets carry risk, and readers are responsible for their own decisions.
Meta description: XAU/USD daily analysis examines the pullback, key support and Fibonacci levels, and conditional bullish and bearish scenarios.