
XAU/USD remains structurally bullish on both the weekly and daily frames, with the main trend classified as up and firm. However, the sub-trend is down, and the latest daily close at 4372.553 sits between the Fibonacci levels at 4328.247 and 4415.295. This leaves gold in a decision area rather than a confirmed directional breakout.
| Metric | Reading |
|---|---|
| Weekly close | 4378.101 |
| Daily close | 4372.553 |
| Weekly and daily trend | Up, firm; sub-trend down |
| Nearest resistance | 4654.564–4697.097 |
| Nearest support | 4160.691–4203.224 |
| Active Fibonacci area | Current retracement ratio 0.440, between 0.382 and 0.5 |
| Structure event | None reported |
Higher-timeframe context
The weekly chart keeps the broader bullish framework intact. Its main trend is up and firm, while the sub-trend is down. The most recent confirmed weekly swing is the high at 5595.362, and no new weekly structure event is reported. The current price therefore represents a pullback within a larger advance rather than a confirmed weekly reversal.
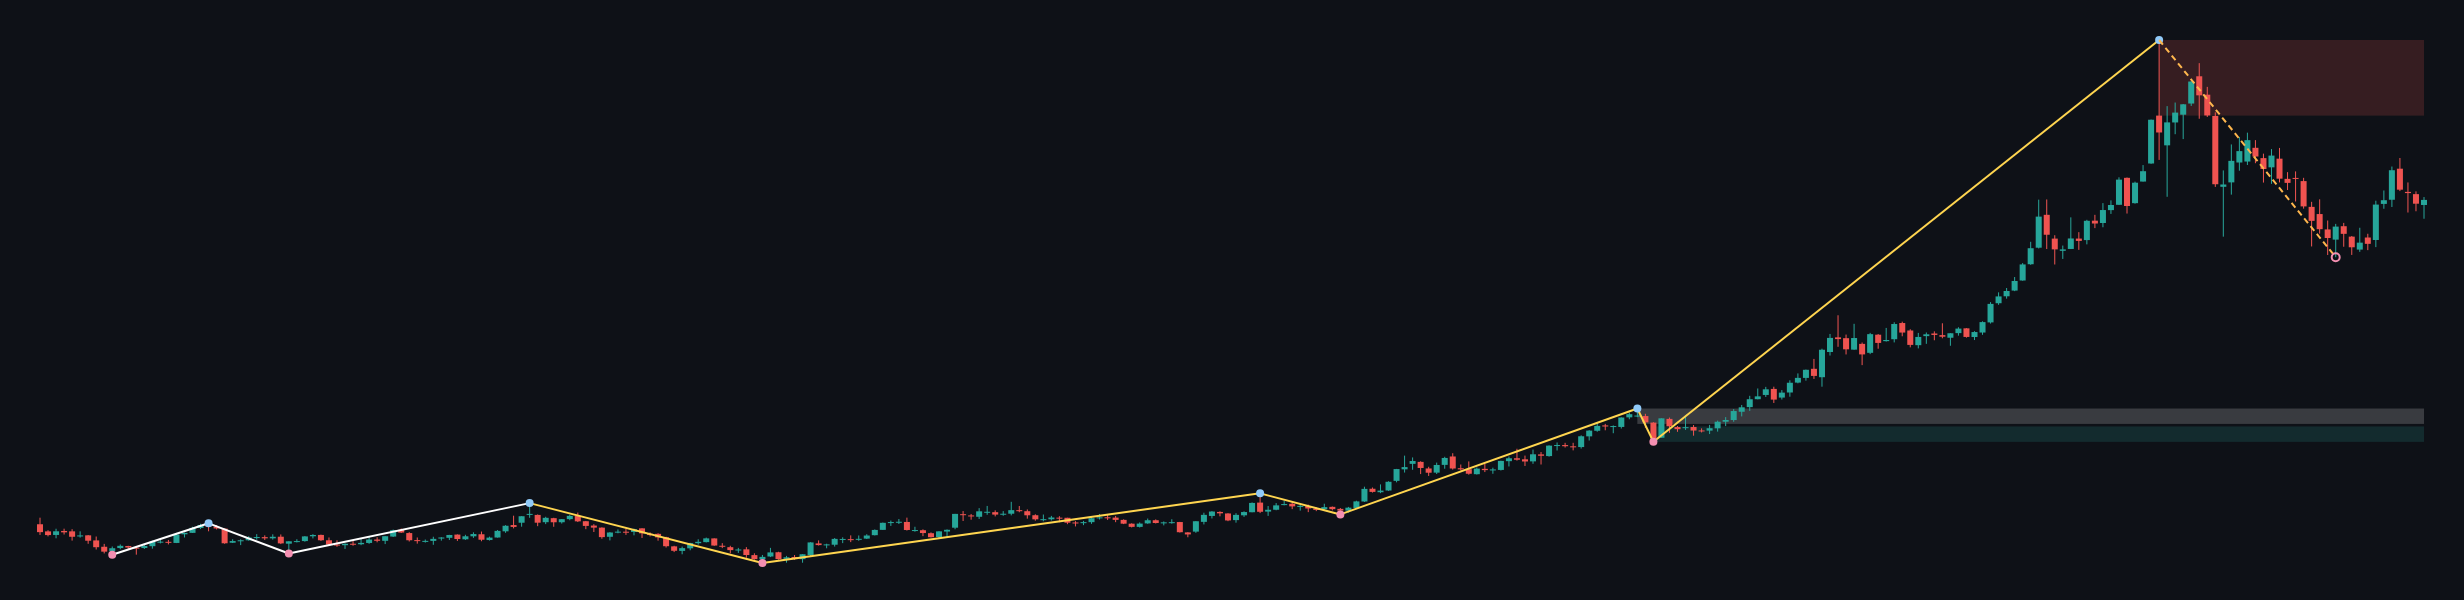
The weekly support map contains the demand zone at 2536.779–2653.710 and the broken-retest zone at 2673.168–2790.099. These areas are well below the current weekly close of 4378.101. Above the market, weekly resistance is marked at 5019.871–5595.362, with the confirmed swing high at 5595.362. The weekly ATR is 233.862, indicating that price can cover substantial distance over a completed weekly movement, although ATR does not determine direction.
The report does not provide exact weekly moving-average values or a weekly Fibonacci set. Their precise position and spacing are therefore not determinable from the supplied data. The higher-timeframe conclusion is conditional: the bullish framework remains permitted while the broader support structure holds, but the weekly sub-trend remains corrective until price produces a fresh structure event.
Main-frame structure
On the daily chart, the main trend is also up and firm, aligning with the weekly direction. At the same time, the daily sub-trend is down, which is consistent with a pullback or consolidation inside the broader advance. No daily structure event is reported, so there is no confirmed break of structure or change of character to justify calling an outright reversal.
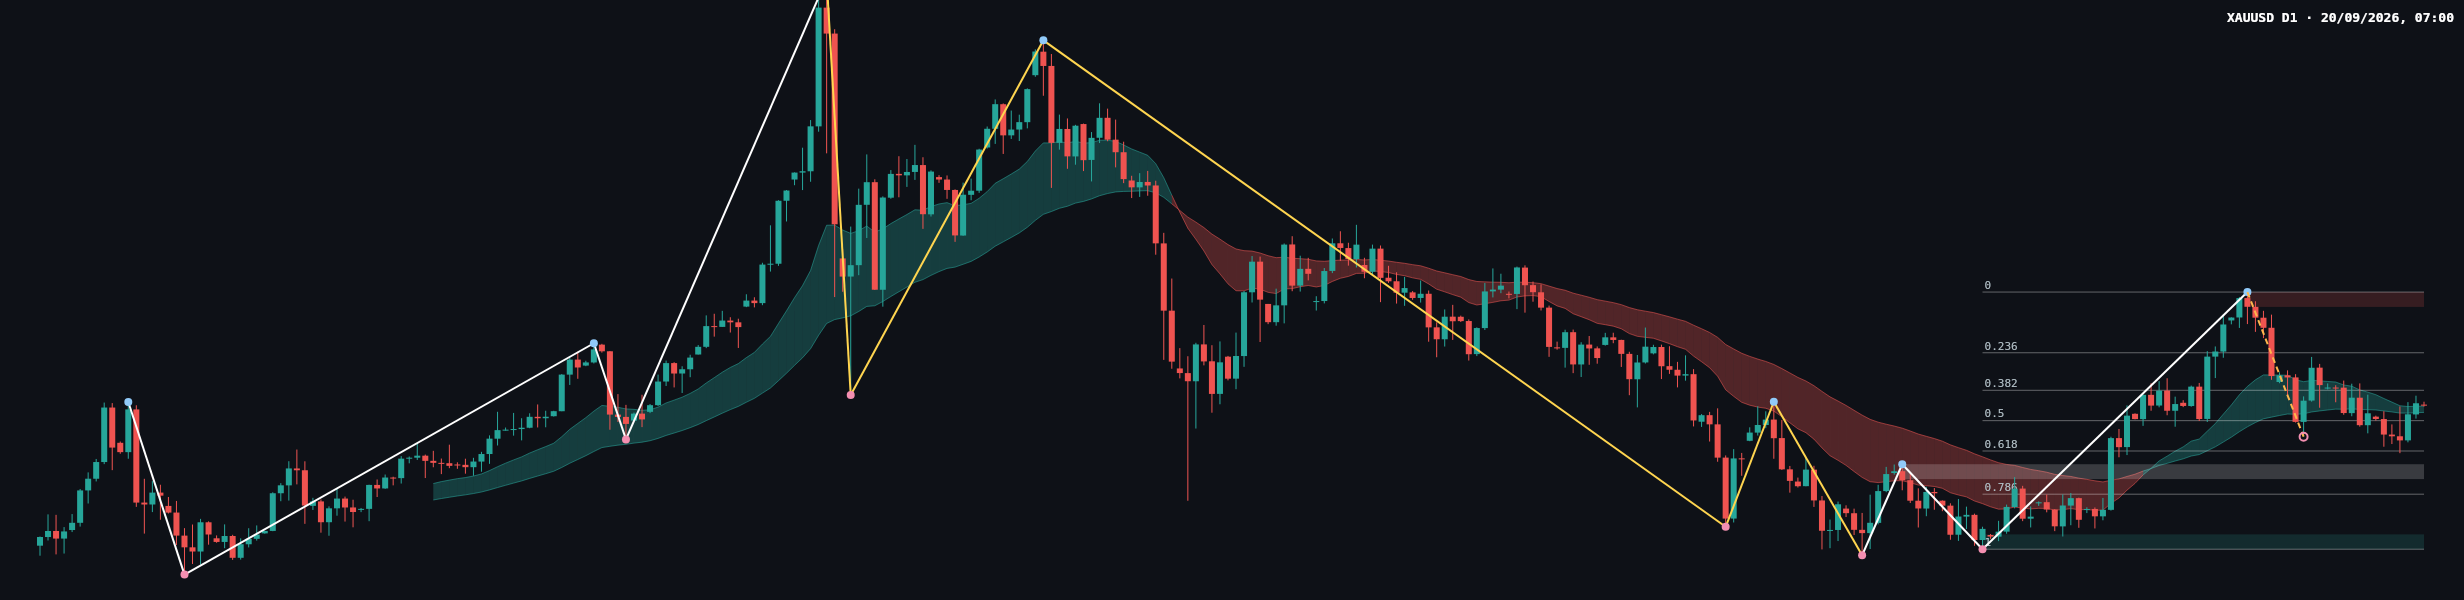
The latest confirmed daily swing high is 4697.097. The daily resistance zone is 4654.564–4697.097, while the broken-retest support zone is 4160.691–4203.224. A deeper support zone is marked at 3959.396–4001.929. The daily ATR is 85.066.
The latest completed Dow leg runs from 4697.097 to 3959.396. Its Fibonacci levels are 4523.000 at 0.236, 4415.295 at 0.382, 4328.247 at 0.5, 4241.198 at 0.618, and 4117.264 at 0.786. The current retracement ratio is 0.440, placing price between the 0.382 and 0.5 retracement levels.
Recent candles and closing-price reading
The most recent daily close at 4372.553 remains below 4415.295 and above 4328.247. The visible sequence shows alternating bullish and bearish candles around the daily moving-average envelope, followed by a modest recovery and renewed hesitation. This is a two-sided auction: buyers have defended the lower part of the recent range, but sellers have not yet allowed a sustained reclaim of the higher Fibonacci area.
The exact candle classification, wick proportions, and moving-average values are not included in the deterministic report, so a precise label such as a pin bar, engulfing candle, or doji is not determinable from the report. The chart does show the close in the central Fibonacci region rather than at the daily resistance zone. That placement signals indecision more than decisive control by either side.
Compared with the preceding visible candles, the latest price action looks more like consolidation than continuation. A close above 4415.295 would improve the bullish interpretation, while a move below 4328.247 would increase the risk of a deeper retracement toward the support structure.
Conditional scenarios
Bullish continuation scenario
If price reclaims and holds above 4415.295, the next important test would be the Fibonacci level at 4523.000, followed by the daily resistance zone at 4654.564–4697.097. This scenario would be invalidated if price returns below 4328.247 after the attempted reclaim. The chart currently gives this scenario a constructive but unconfirmed status.
Range and recovery scenario
If price continues to oscillate between 4328.247 and 4415.295, the dominant condition would remain daily consolidation. A successful defense of 4328.247 could keep the market focused on a later test of 4415.295, while repeated rejection below that level would preserve the corrective sub-trend. This scenario is invalidated by a sustained move outside that Fibonacci band.
Bearish retracement scenario
If price breaks below 4328.247, the next Fibonacci reference is 4241.198, with the broken-retest support zone at 4160.691–4203.224 becoming the key area below. A deeper decline could expose 4117.264 and then the support zone at 3959.396–4001.929. This bearish scenario would be weakened if price reclaims 4415.295; it would be invalidated as an active downside sequence if price returns through the upper Fibonacci area and challenges 4523.000.
Key levels and confirmation conditions
- 4654.564–4697.097: daily resistance and the latest confirmed swing-high area.
- 4523.000: upper Fibonacci reference.
- 4415.295: nearby resistance and the 0.382 retracement.
- 4372.553: latest daily close.
- 4328.247: central Fibonacci support at 0.5.
- 4241.198: 0.618 retracement reference.
- 4160.691–4203.224: broken-retest support zone.
- 3959.396–4001.929: deeper daily support zone.
The cleanest confirmation would be a daily close beyond either side of the 4328.247–4415.295 band, followed by evidence that the broken level is being accepted rather than immediately rejected. Traders should also account for false breakouts, liquidity sweeps, and volatility around major US economic releases. The supplied data does not identify a scheduled event or exact release time.
General risk control remains important in either direction: keep exposure proportionate to account risk, avoid treating a single candle as confirmation, and consider the possibility that volatility can expand beyond the recent range. The weekly ATR of 233.862 and daily ATR of 85.066 describe recent movement potential, not guaranteed future ranges.
Summary
- The weekly and daily primary trends remain up and firm.
- Both timeframes also show a down sub-trend, making the current move corrective.
- The daily close at 4372.553 is between 4328.247 and 4415.295.
- A recovery above 4415.295 would refocus attention on 4523.000 and the resistance zone at 4654.564–4697.097.
- A break below 4328.247 would expose 4241.198 and potentially 4160.691–4203.224.
The single most important thing today is whether price establishes acceptance above 4415.295 or loses 4328.247.
#XAUUSD #GoldAnalysis #TechnicalAnalysis #PriceAction #Forex
Meta description: XAU/USD remains bullish on higher timeframes but consolidates daily between key Fibonacci levels at 4328.247 and 4415.295.
This article is technical analysis and reference information only, not investment advice. Markets carry risk, and readers are responsible for their own decisions.