
XAU/USD remains within a broader uptrend, with the latest closed price at 4332.980 on the daily frame and 4349.341 on the weekly context frame. The notable feature is the conflict between the firm primary trend and the current downward sub-trend: price is consolidating close to the daily 0.5 Fibonacci level at 4328.247, leaving both continuation and deeper-pullback scenarios open.
| Metric | Reading |
|---|---|
| Latest closed price | 4332.980 on the daily frame; 4349.341 on the weekly frame |
| Weekly / Daily trend | Up, firm; down sub-trend on both frames |
| Nearest resistance | 4415.295 Fibonacci level, followed by the daily resistance zone at 4652.680 – 4697.097 |
| Nearest support | 4328.247 Fibonacci level, followed by the daily support zone at 4158.807 – 4203.224 |
| Active Fibonacci reading | Current retracement ratio: 0.494, close to the 0.5 level |
| Market condition | Consolidation within a broader uptrend |
Higher-timeframe context: Weekly
The weekly structure remains an uptrend with a firm primary trend, while the sub-trend is down. No weekly structure event is reported, so the current decline is better treated as a retracement within the larger structure rather than a confirmed reversal. The most recent confirmed weekly swing high is 5595.362.
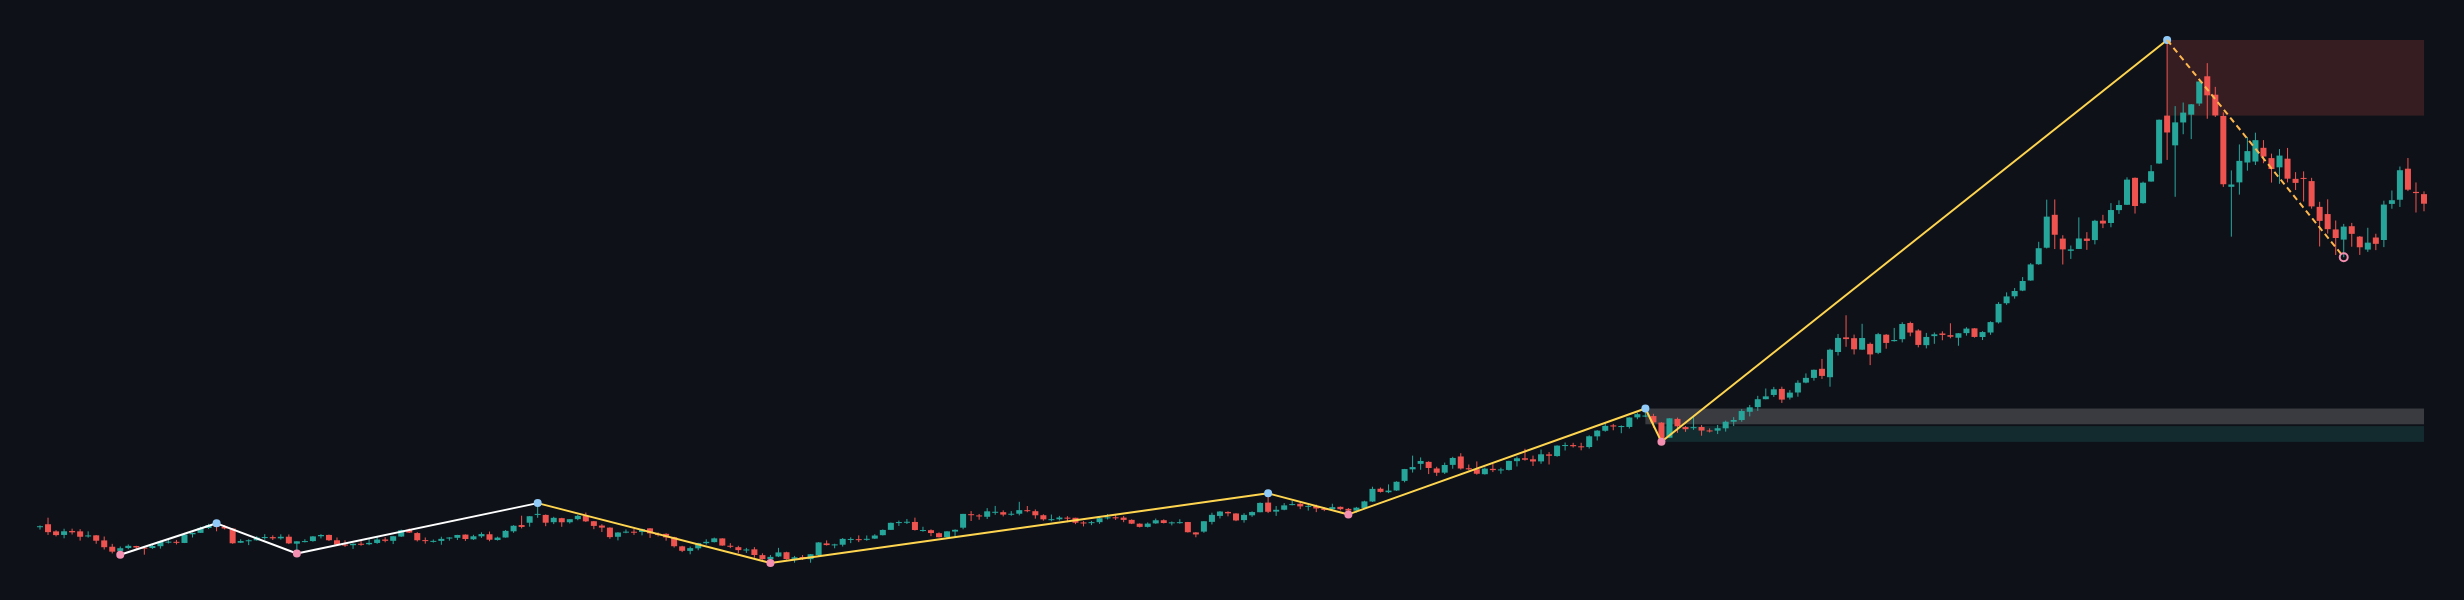
The principal weekly support zone is 2536.779 – 2656.367. A second area at 2670.511 – 2790.099 is marked as a broken-retest support zone. Above the market, weekly resistance is defined by 5019.871 – 5595.362. These zones frame a broad structure in which the primary trend still favors the upside, but the active sub-trend remains corrective.
The weekly ATR is 239.175, indicating a materially wider context range than the daily ATR. The report does not provide numerical weekly EMA values, so exact EMA positioning, spacing, or crossover status is not determinable from the data report. The weekly conclusion is conditional: the broader structure permits renewed upside while price remains above the major support areas, but the down sub-trend keeps a deeper retracement in play.
Main-frame structure: Daily
The daily frame also records a firm primary uptrend with a down sub-trend, aligning with the weekly corrective phase. No daily structure event is reported. The most recent confirmed daily swing high is 4697.097, while the daily resistance zone is 4652.680 – 4697.097.
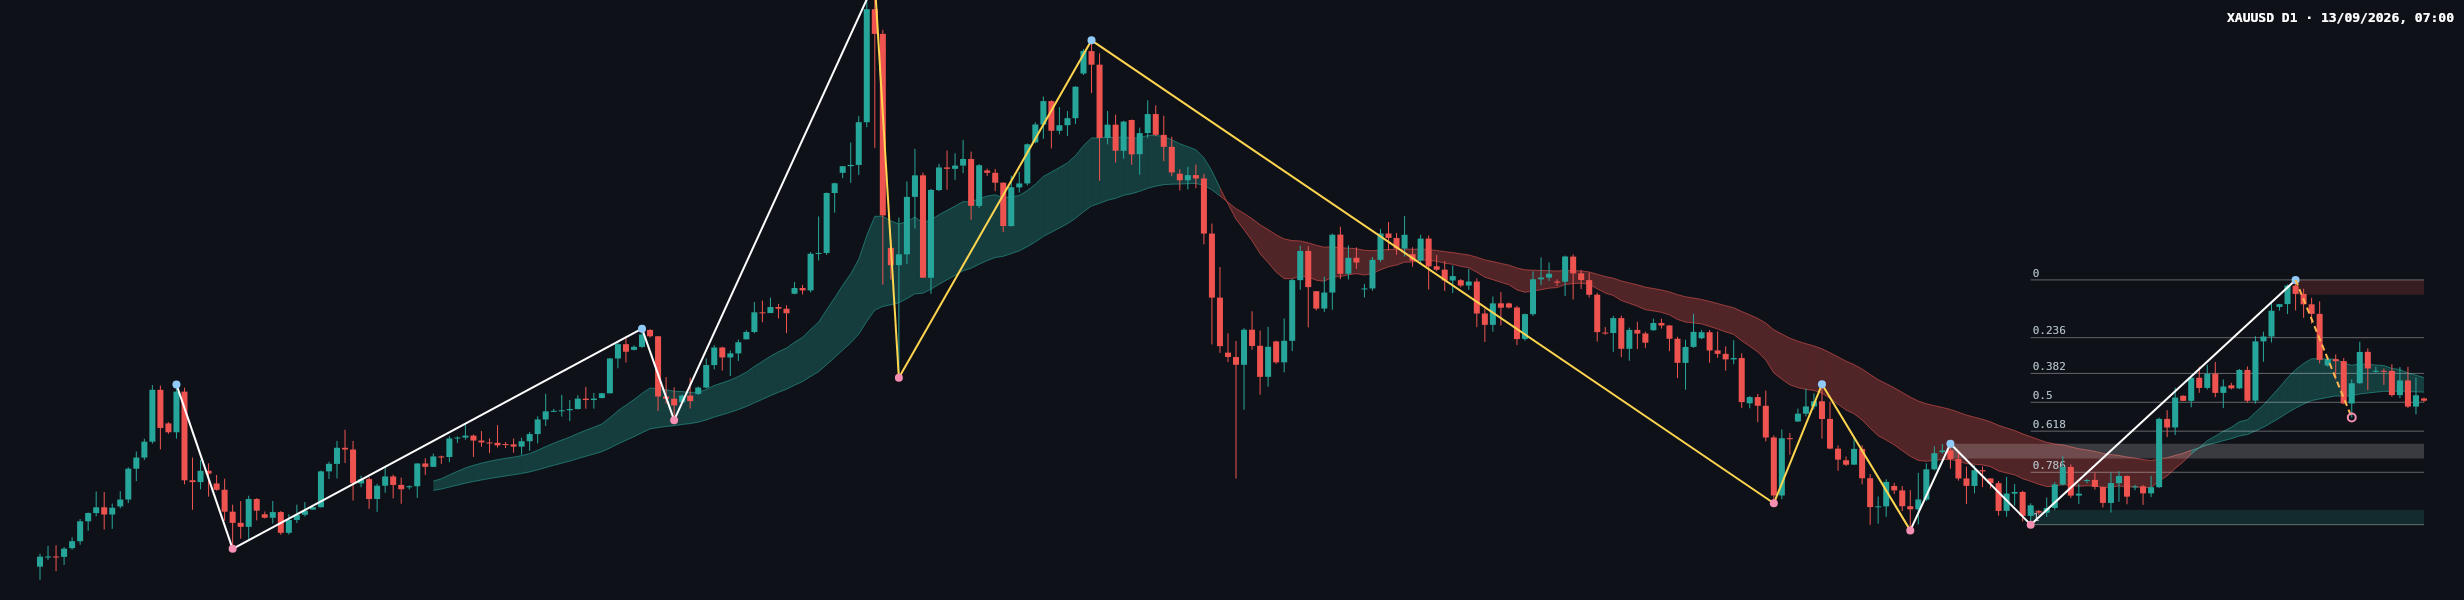
The latest completed Fibonacci leg runs from 4697.097 at level 0 to 3959.396 at level 1. The current retracement ratio is 0.494, placing price close to the 0.5 level at 4328.247. The next upside reference is the 0.382 level at 4415.295; the next lower references are the 0.618 level at 4241.198 and the 0.786 level at 4117.264.
On the recent candles, the chart shows a rebound from the lower daily support area followed by hesitation around the middle of the Fibonacci leg. The latest candles are comparatively compressed and alternate in direction, suggesting that neither side has established decisive control. The visible EMA bands also show the corrective phase, but exact EMA values and any formal crossover are not determinable from the report. Daily ATR is 88.834, providing a narrower volatility framework than the weekly reading.
Key levels and price behaviour
- 4697.097: most recent confirmed daily swing high and upper boundary of the daily resistance zone.
- 4652.680 – 4697.097: daily resistance area where a renewed advance would meet prior supply.
- 4415.295: daily 0.382 Fibonacci level and the first upside reference above the current consolidation.
- 4328.247: daily 0.5 Fibonacci level, currently close to the latest daily close at 4332.980.
- 4241.198: daily 0.618 Fibonacci level and the first lower retracement reference.
- 4158.807 – 4203.224: broken-retest daily support zone.
- 4117.264: daily 0.786 Fibonacci level.
- 3959.396: Fibonacci level 1 and lower boundary of the daily support zone at 3959.396 – 4003.813.
Conditional scenarios
Bullish continuation scenario
If price holds around 4328.247 and reclaims 4415.295, the corrective daily sequence would weaken. The next area to monitor would be the daily resistance zone at 4652.680 – 4697.097. Invalidation would be a sustained move below 4328.247, because that would show that the middle Fibonacci support is not holding.
Bearish retracement scenario
If price remains below 4415.295 and breaks beneath 4328.247, attention would shift to 4241.198 and the support zone at 4158.807 – 4203.224. Invalidation would be a recovery above 4415.295, which would indicate that sellers have failed to extend the retracement.
Deeper downside scenario
If the lower Fibonacci reference at 4241.198 fails and the broken-retest support zone at 4158.807 – 4203.224 does not hold, the next references would be 4117.264 and the support zone at 3959.396 – 4003.813. Invalidation would be a recovery above 4241.198 after the breakdown, signalling rejection of the lower path.
Closing view
The primary trend remains up on both timeframes, but the current sub-trend is down and price is testing the decision area around 4328.247. A recovery through 4415.295 would improve the case for continuation toward the daily resistance zone, while a loss of 4328.247 would keep the lower Fibonacci references active.
#XAUUSD #Gold #PriceAction #TechnicalAnalysis #Fibonacci
Meta description: XAU/USD holds near the daily 0.5 Fibonacci level as a firm primary uptrend meets a corrective sub-trend.
This article is technical analysis and reference information only, not investment advice. Markets carry risk, and readers are responsible for their own decisions.