
XAU/USD remains structurally constructive on both the weekly and daily frames, with the main trend classified as up and firm. However, the sub-trend is down, and the daily close at 4350.067 leaves gold in a decision area around the latest Fibonacci retracement rather than at a confirmed breakout point. The most notable feature is the interaction between the current price, the 0.5 Fibonacci level at 4328.247, and the nearby 0.382 level at 4415.295.
Higher-timeframe context: Weekly
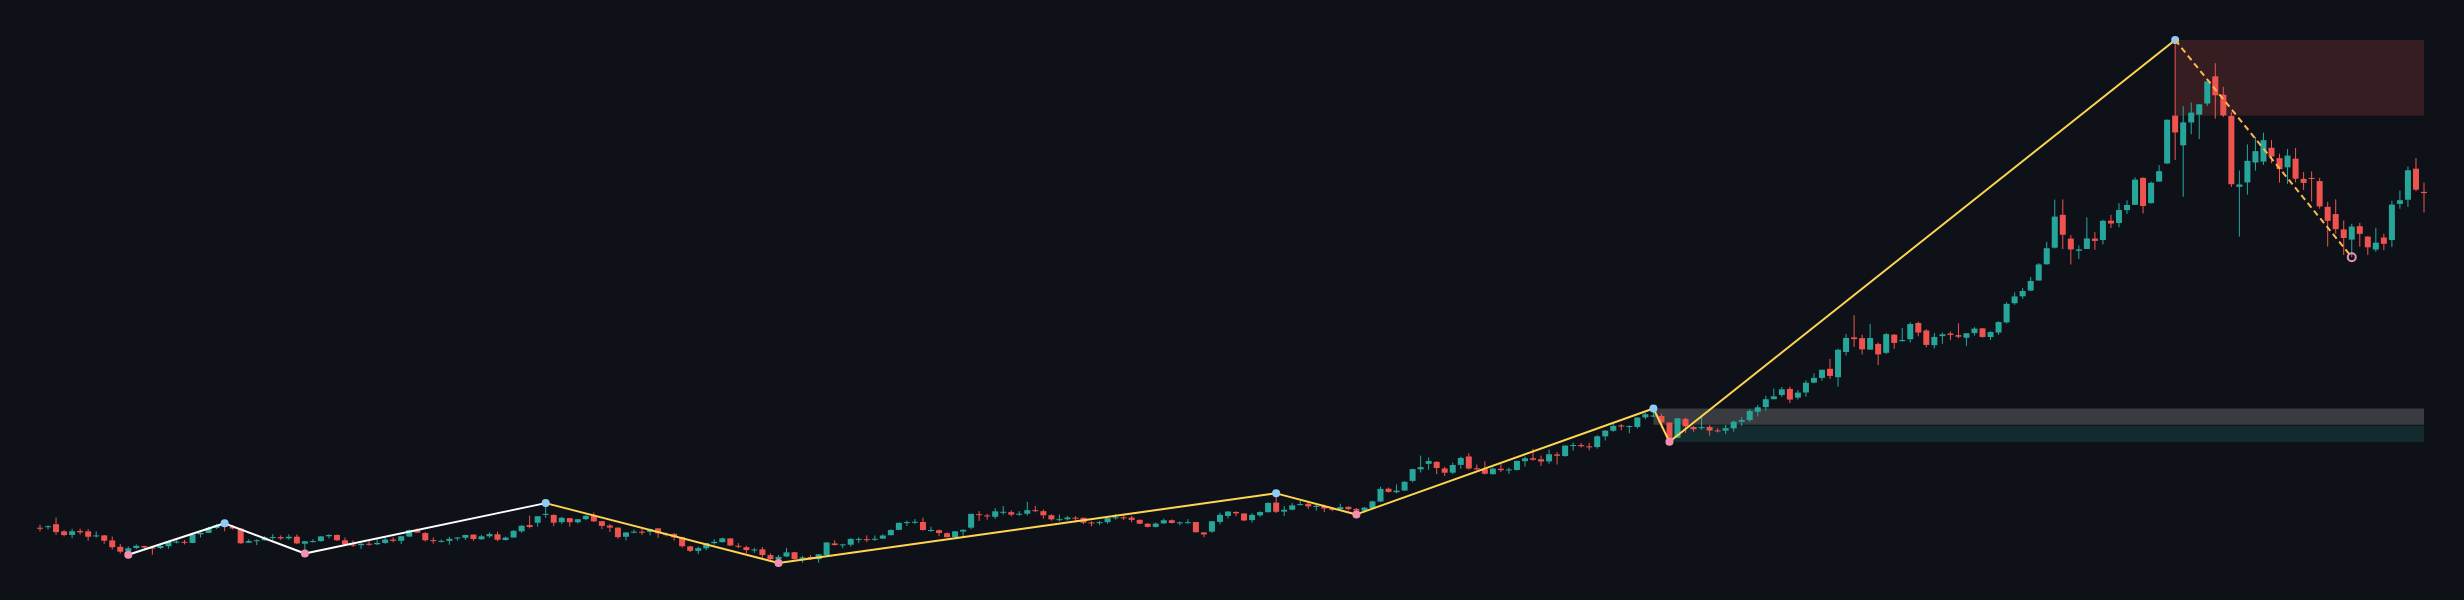
The weekly framework continues to favor the buyers because the main trend is up and firm. The most recent confirmed weekly swing is the high at 5595.362, while no weekly structure event has been recorded. The sub-trend is down, so the larger advance is currently undergoing a corrective phase rather than displaying a confirmed structural reversal.
The weekly last closed price is 4430.194. The report does not provide numerical weekly EMA values or their exact spacing, so the relationship between price and those averages is not determinable from the report. The weekly ATR is 245.936, indicating a materially wider context range than the daily ATR of 90.147.
The principal weekly support areas are 2536.779–2659.747 and the broken-retest zone at 2667.131–2790.099. The major weekly resistance zone is 5019.871–5595.362. Relative to the weekly close at 4430.194, price is below that resistance and above the listed weekly support areas. This places the market in space between the major zones, although the current correction keeps the shorter-term bias under pressure.
The weekly conclusion is conditional: holding above the daily and weekly retracement structure would preserve the broader bullish framework, while a sustained move toward the lower support architecture would weaken that framework. No weekly break of structure is currently reported.
Main-frame structure: Daily
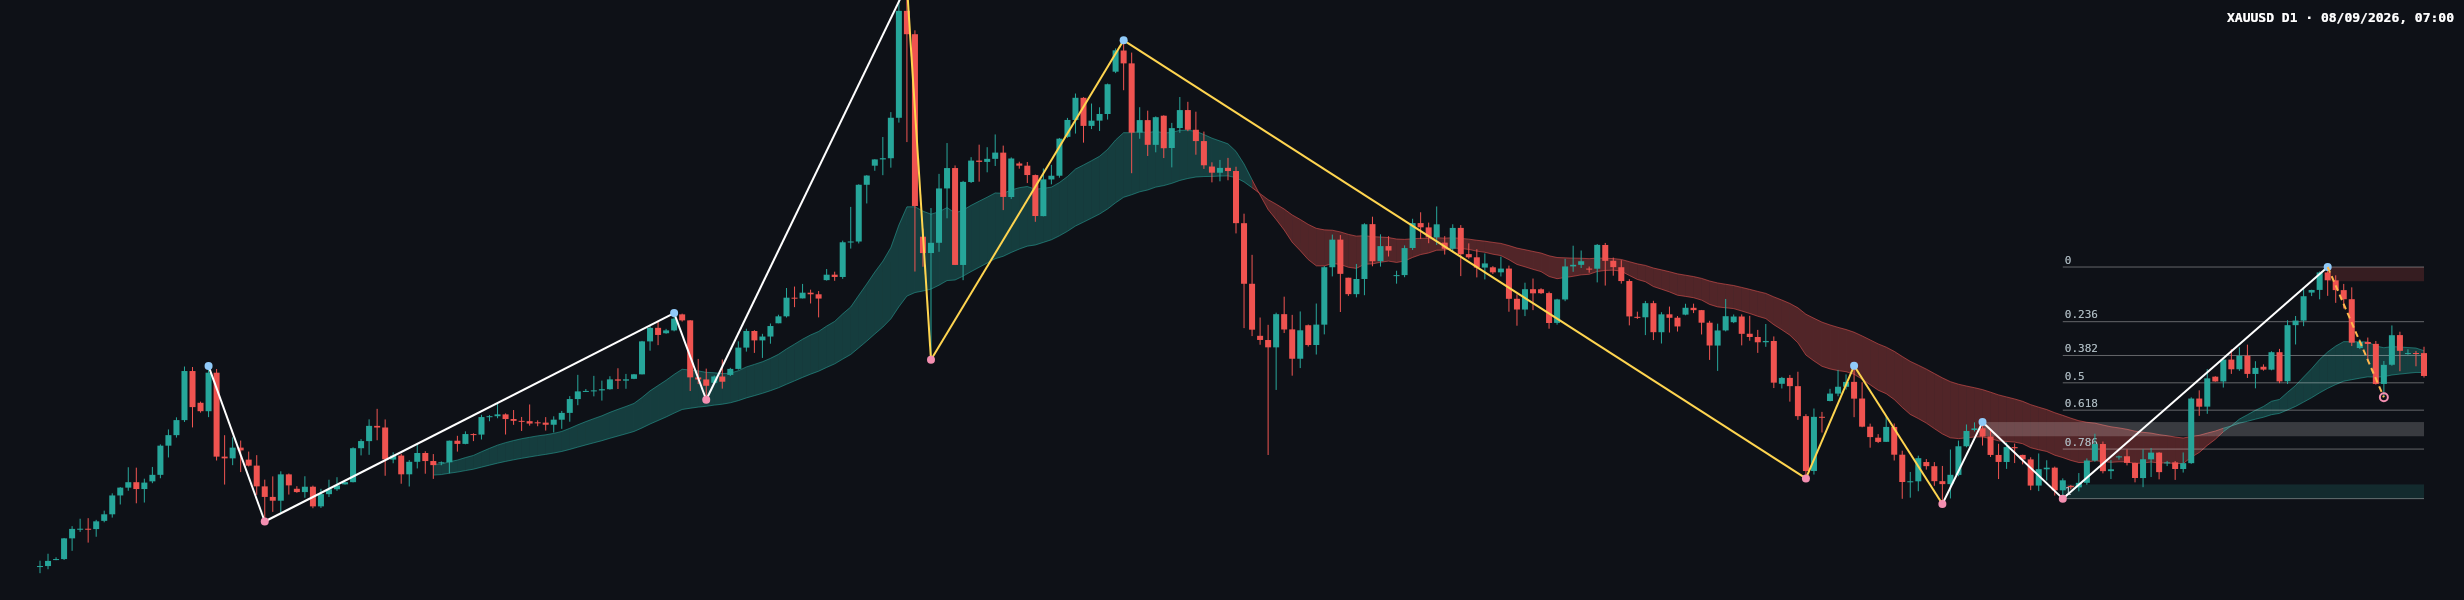
The daily main trend is also up and firm, aligning with the weekly direction. At the same time, the daily sub-trend is down and no daily structure event has been recorded. This combination is consistent with a pullback inside a broader advance, but it does not rule out a deeper correction unless price reclaims the upper daily structure.
The latest daily close is 4350.067. Numerical EMA20 and EMA50 values are not included in the deterministic report, so their exact position, slope, spacing, and any crossover are not determinable. The daily resistance zone is 4652.024–4697.097, with the upper boundary matching the most recent confirmed daily swing high at 4697.097. The broken-retest support zone is 4158.151–4203.224, while the lower daily support zone is 3959.396–4004.469.
The latest completed Dow leg runs from 4697.097 to 3959.396. Its Fibonacci levels are 4523.000 at 0.236, 4415.295 at 0.382, 4328.247 at 0.5, 4241.198 at 0.618, and 4117.264 at 0.786. The current retracement ratio is 0.470, placing the close at 4350.067 between 4415.295 and 4328.247. This is a neutral-to-decisive area: recovery above 4415.295 would improve the short-term structure, while acceptance below 4328.247 would expose deeper retracement levels.
The last several candles on the chart show a sharp decline from the upper resistance area, followed by a rebound and renewed hesitation around the retracement grid. The recent candle sequence contains alternating bullish and bearish bodies, with rejection visible near the upper part of the daily range and renewed selling near the current closing area. Exact candle classifications, ranges, and wick measurements are not determinable from the report. Volume and momentum readings are also not provided.
Reading the most recent closing candle
The latest closing candle cannot be assigned a definitive named pattern from the deterministic report. Its close at 4350.067 is below 4415.295 and above 4328.247, placing it in the middle portion of the latest completed Fibonacci leg rather than at a confirmed daily support or resistance boundary.
That location suggests neither side has established a decisive structural result. Buyers would need to regain the area around 4415.295 and then challenge 4523.000 to improve the recovery case. Sellers would gain confirmation from sustained acceptance below 4328.247, with 4241.198 and the support zone at 4158.151–4203.224 then becoming important reference areas.
Scenarios
Primary scenario: recovery through the middle retracement
If price reclaims 4415.295, the recovery scenario would point toward 4523.000 and, if that level is cleared, the daily resistance zone at 4652.024–4697.097. The scenario would be weakened by renewed acceptance below 4328.247. Its probability is not determinable from the report.
Secondary scenario: continuation of the daily pullback
If price breaks and holds below 4328.247, the next Fibonacci reference is 4241.198, followed by the broken-retest support zone at 4158.151–4203.224. A sustained recovery above 4415.295 would invalidate this bearish continuation scenario. Its probability is not determinable from the report.
Risk scenario: deeper correction toward lower daily support
If selling persists through 4158.151–4203.224, the lower support zone at 3959.396–4004.469 becomes the next major area to observe. A recovery above 4415.295 would invalidate the deeper-correction interpretation. Its probability is not determinable from the report.
The current bias is cautiously balanced inside the broader uptrend: the key decision points are 4415.295 above and 4328.247 below, with the daily ATR at 90.147 providing context for potentially meaningful movement between these levels.
Key levels and considerations
- Near resistance: 4415.295, followed by 4523.000.
- Far resistance: 4652.024–4697.097, then weekly resistance at 5019.871–5595.362.
- Near support: 4328.247 and 4241.198.
- Far support: 4158.151–4203.224 and 3959.396–4004.469.
- Weekly support context: 2536.779–2659.747 and 2667.131–2790.099.
The most informative zones to observe are the Fibonacci band between 4415.295 and 4328.247, the broken-retest support at 4158.151–4203.224, and the daily resistance at 4652.024–4697.097. A close beyond one of these boundaries followed by sustained acceptance would provide more useful confirmation than an isolated intraday move.
The report contains no scheduled-news information, DXY data, US Treasury yield data, or economic-calendar timing. Those factors remain relevant external drivers for gold, but their current readings are not determinable here. Traders should also account for the possibility of false breaks and volatility around major macroeconomic releases. No position-sizing or execution instruction is implied by these scenarios.
Summary
- The weekly and daily main trends remain up and firm, while both sub-trends are down.
- The daily close at 4350.067 sits between 4415.295 and 4328.247.
- A recovery above 4415.295 would bring 4523.000 and 4652.024–4697.097 into focus.
- A break below 4328.247 would shift attention toward 4241.198 and 4158.151–4203.224.
- The single most important thing today is whether price establishes acceptance above 4415.295 or below 4328.247.
#XAUUSD #Gold #TechnicalAnalysis #PriceAction #Forex
Meta description: XAU/USD daily analysis: gold trades between 4415.295 resistance and 4328.247 Fibonacci support within a broader uptrend.
This article is technical analysis and reference information only, not investment advice. Markets carry risk, and readers are responsible for their own decisions.