
XAU/USD remains structurally bullish on both the weekly and daily timeframes, but the active sub-trend is downward. The latest closed price is 4324.674, placing the market close to the main-frame Fibonacci 0.5 level at 4328.247. The most notable feature is the contrast between firm higher-timeframe upside structure and a daily pullback that has not yet produced a confirmed structure break.
Higher-timeframe context: Weekly structure
The weekly main trend is up and described as firm, while the sub-trend is down. The most recent confirmed weekly swing is a high at 5595.362, and the report identifies no structure event. This keeps the broader bullish framework intact, although the decline from that swing high shows that momentum has moderated.
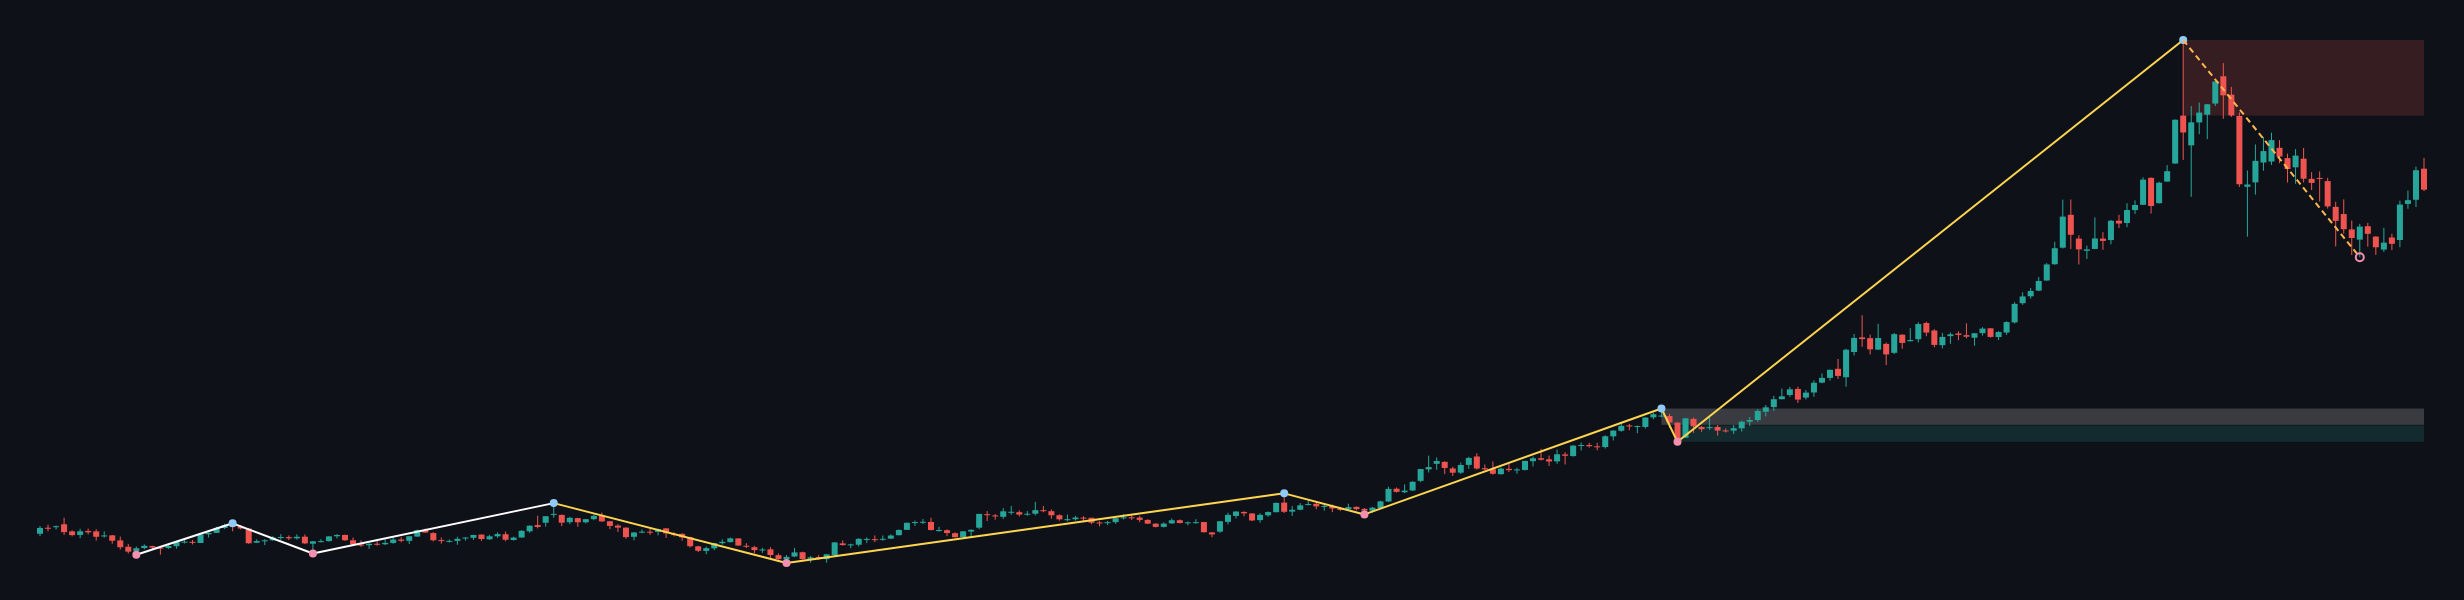
Weekly price is being assessed against a major support zone at 2536.779–2660.409 and a higher support zone at 2666.469–2790.099, identified as a broken-retest area. Above the market, the principal weekly resistance zone is 5019.871–5595.362. These zones frame the larger structure: the market is below major resistance and well above the listed weekly demand areas.
The weekly ATR is 247.260, indicating a substantially wider higher-timeframe volatility envelope than the daily ATR. Exact weekly EMA values are not provided in the deterministic report, so their numerical positions and spacing are not determinable here. The chart does, however, show the broader advance followed by a corrective phase rather than a confirmed weekly reversal.
Weekly conclusion: The weekly structure permits further corrective movement while price remains above the listed support areas, but it continues to favour the bullish side while no weekly structure break is recorded. A sustained move toward the weekly resistance zone would require renewed upside acceptance, whereas a move toward the support zones would represent a deeper retracement of the larger advance.
Main-frame structure: Daily analysis
The daily main trend is also up and firm, while the sub-trend is down. This aligns with the weekly framework in the broad direction but differs in the immediate path: the daily decline is currently better classified as a pullback than as an established reversal because the report records no structure event.
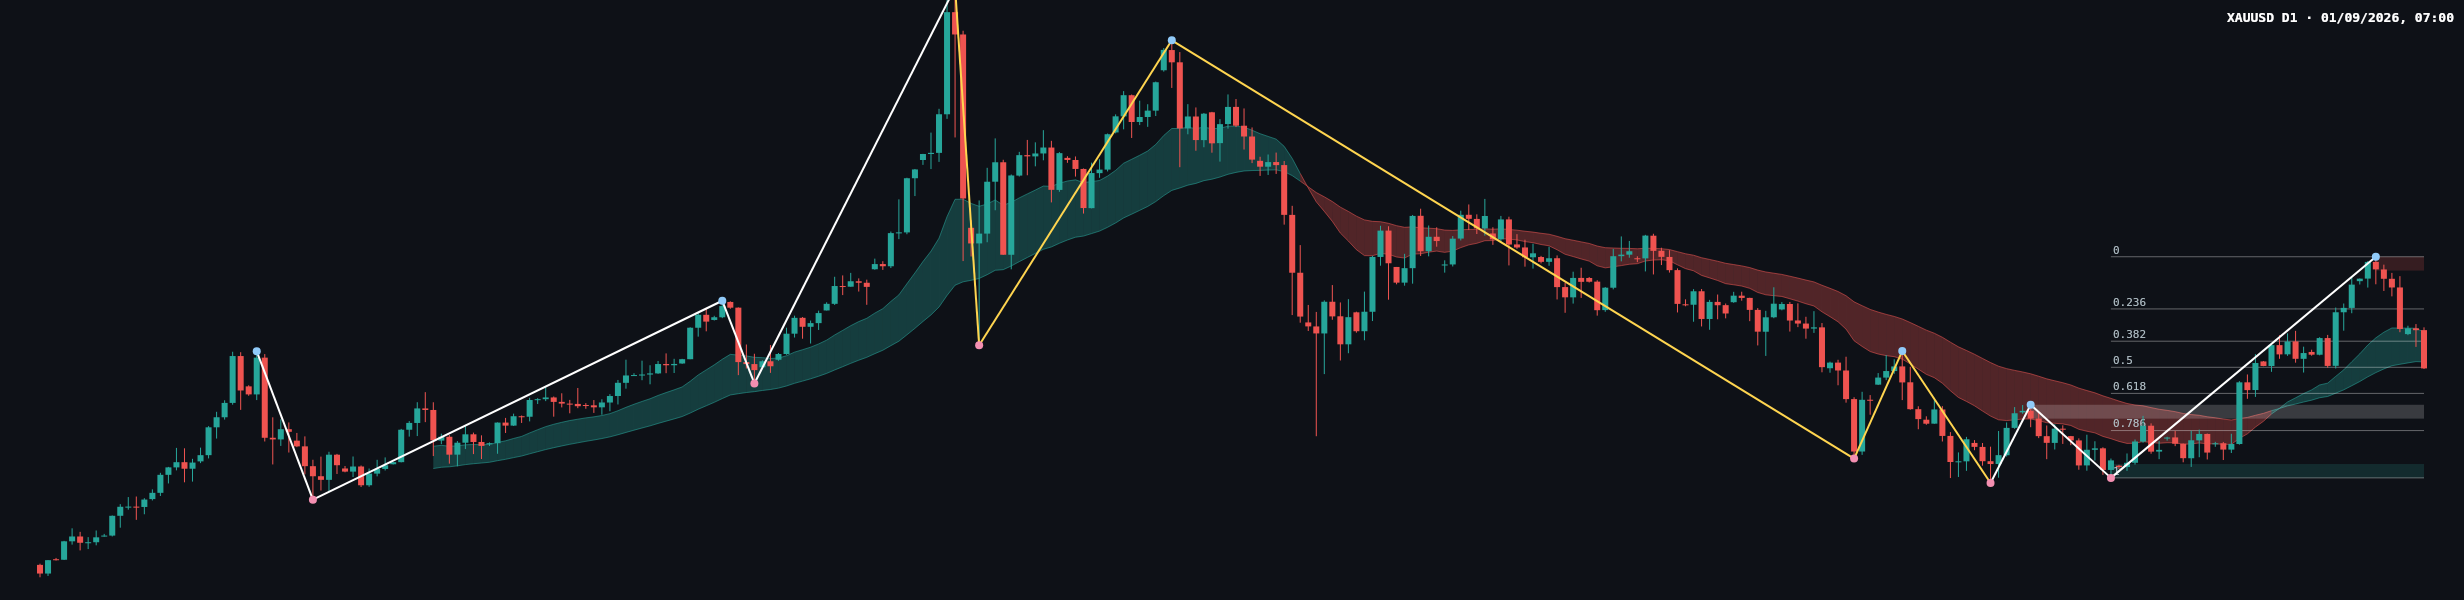
The latest daily swing high is 4697.097. The daily resistance zone is 4650.970–4697.097, while the principal support zone is 3959.396–4005.523. A second support zone at 4157.097–4203.224 is marked as broken-retest support. The daily ATR is 92.253, which provides context for a more contained decision range than the weekly chart.
The latest completed Dow leg runs from 4697.097 to 3959.396. Its Fibonacci levels are 4523.000 at 0.236, 4415.295 at 0.382, 4328.247 at 0.5, 4241.198 at 0.618, and 4117.264 at 0.786. The current retracement ratio is 0.505, placing price around the 0.5 retracement area. The close at 4324.674 is marginally below 4328.247, making that level the immediate reference for whether buyers can regain control of the midpoint.
Exact EMA20 and EMA50 values are not included in the report, so their numerical levels, spacing and any crossover are not determinable. The chart shows price interacting with the daily moving-average envelope during the recent rebound and subsequent hesitation, but the absence of a reported structure event is more important than assigning an unreported EMA value.
Recent candles and closing-candle reading
The most recent group of daily candles shows a rebound from the lower part of the visible range, followed by a rise toward the upper reference area and then a pullback. The candles near the rebound include both directional bodies and rejection wicks, suggesting that buyers were able to lift price from lower levels but did not maintain uninterrupted control. The latest candle is bearish, with the close at 4324.674 near the 0.5 Fibonacci level at 4328.247.
Relative to the preceding candles, the latest close acts as a warning of renewed selling pressure rather than a confirmed reversal signal. The close below 4328.247 places sellers slightly ahead at the latest settlement, but the candle is not sufficient by itself to establish a daily bearish structure break. A recovery above 4328.247 would improve the near-term buyer narrative; continued acceptance below it would keep attention on 4241.198 and the broken-retest zone at 4157.097–4203.224.
Volume and a numerical momentum reading are not supplied in the report. Accordingly, volume confirmation or divergence is not determinable from the available data.
Key levels
- 4697.097: most recent confirmed daily swing high and upper boundary of the daily resistance area.
- 4650.970–4697.097: daily resistance zone.
- 4523.000: 0.236 Fibonacci level.
- 4415.295: 0.382 Fibonacci level.
- 4328.247: 0.5 Fibonacci level and immediate midpoint reference.
- 4241.198: 0.618 Fibonacci level.
- 4157.097–4203.224: broken-retest support zone.
- 4117.264: 0.786 Fibonacci level.
- 3959.396–4005.523: daily support zone.
- 5019.871–5595.362: major weekly resistance zone.
- 2536.779–2660.409 and 2666.469–2790.099: major weekly support areas.
Conditional scenarios
Bullish scenario
If daily price reclaims and sustains above 4328.247, the recovery case would initially point toward 4415.295 and then 4523.000. A stronger extension would bring the daily resistance zone at 4650.970–4697.097 back into focus. This scenario would be invalidated by renewed acceptance below 4241.198, particularly if the market then tests the broken-retest support zone at 4157.097–4203.224. This is the constructive scenario, but confirmation above the midpoint remains necessary.
Bearish scenario
If price remains below 4328.247 and breaks beneath 4241.198, the corrective path would expose the broken-retest support zone at 4157.097–4203.224. A deeper decline could bring 4117.264 and the daily support zone at 3959.396–4005.523 into view. The bearish pullback scenario would be weakened by a sustained recovery above 4415.295 and invalidated as an immediate downside continuation case if price reclaims the resistance zone at 4650.970–4697.097.
Range and failed-break scenario
Price may continue oscillating between the midpoint at 4328.247 and the nearby Fibonacci references at 4241.198 and 4415.295. In this case, a brief move through one level that fails to hold would favour a range interpretation rather than a confirmed directional move. The range scenario would lose relevance after sustained acceptance above 4415.295 or below 4241.198.
Session considerations
The cleanest signals would come from observing how price behaves around 4328.247, 4241.198, 4415.295 and the broken-retest zone at 4157.097–4203.224. A daily close and subsequent retest would provide stronger confirmation than a temporary intraday excursion. False breaks and liquidity sweeps are possible around visible Fibonacci levels, while gold can also experience sharper movement during the US session.
The Asian session may establish an initial range, the European session can test that range, and the US session often supplies the most important volatility. These are general session tendencies, not forecasts. No economic-calendar schedule or exact event time is provided in the report, so specific news timing is not determinable. Traders should nevertheless monitor the DXY, US ten-year yields, inflation data, employment data, Federal Reserve communication and geopolitical headlines, all of which can alter gold volatility.
Summary
- The weekly and daily main trends remain firmly up, while both sub-trends are down.
- The daily close at 4324.674 is testing the 0.5 Fibonacci reference at 4328.247.
- A recovery above 4328.247 would refocus attention on 4415.295, 4523.000 and the resistance zone at 4650.970–4697.097.
- A break below 4241.198 would increase the relevance of 4157.097–4203.224 and potentially 3959.396–4005.523.
- No confirmed daily or weekly structure event has been reported.
The single most important thing today is whether price can regain and hold 4328.247 or instead remains below it and moves toward 4241.198.
This article is technical analysis and reference information only, not investment advice. Markets carry risk, and readers are responsible for their own decisions.
#XAUUSD #GoldAnalysis #PriceAction #DowTheory #TechnicalAnalysis
Meta description: XAU/USD daily analysis: gold tests the 0.5 Fibonacci level at 4328.247 within a firm broader uptrend, with key support and resistance zones mapped.