
XAU/USD is presenting a mixed multi-timeframe picture. The weekly framework remains firmly bullish above the broader support zones at 2536.779–2660.238 and 2666.640–2790.099, but the weekly sub-trend is down from the confirmed high at 5595.362. On the daily chart, price has recovered to a last closed price of 4654.895 and has produced a change of character through 4382.441. That recovery is constructive, but it now needs to hold above the former daily resistance area at 4331.294–4382.441.
| Metric | Value |
|---|---|
| Context last closed price | 4604.083 |
| Main-frame last closed price | 4654.895 |
| Weekly / Daily trend | Up, firm / Down, shaky |
| Weekly sub-trend / Daily sub-trend | Down / Up |
| Nearest daily resistance | 4331.294–4382.441 |
| Nearest daily support | 3942.138–4005.629 |
| Active Fibonacci level | 1.000 at 4382.441 |
| Daily structure event | CHoCH through 4382.441 |
Higher-timeframe context
The weekly trend is up and described as firm, with no new structure event recorded. The most recent confirmed swing is the high at 5595.362, while the visible pullback has produced a down sub-trend. This means the larger bullish structure remains intact, but price is still working through a correction beneath the weekly resistance zone at 5019.871–5595.362.
The weekly support area at 2536.779–2660.238 is the principal lower demand zone in the report. A second zone at 2666.640–2790.099 is marked as a broken-retest area. These zones are materially below the current weekly close of 4604.083, while the weekly resistance zone at 5019.871–5595.362 is the next major overhead area.
The weekly ATR is 246.918, indicating a wider context range than the daily ATR of 87.656. EMA values and their exact slopes are not determinable from the deterministic report, so no precise comparison between weekly EMA20 and EMA50 is made here.
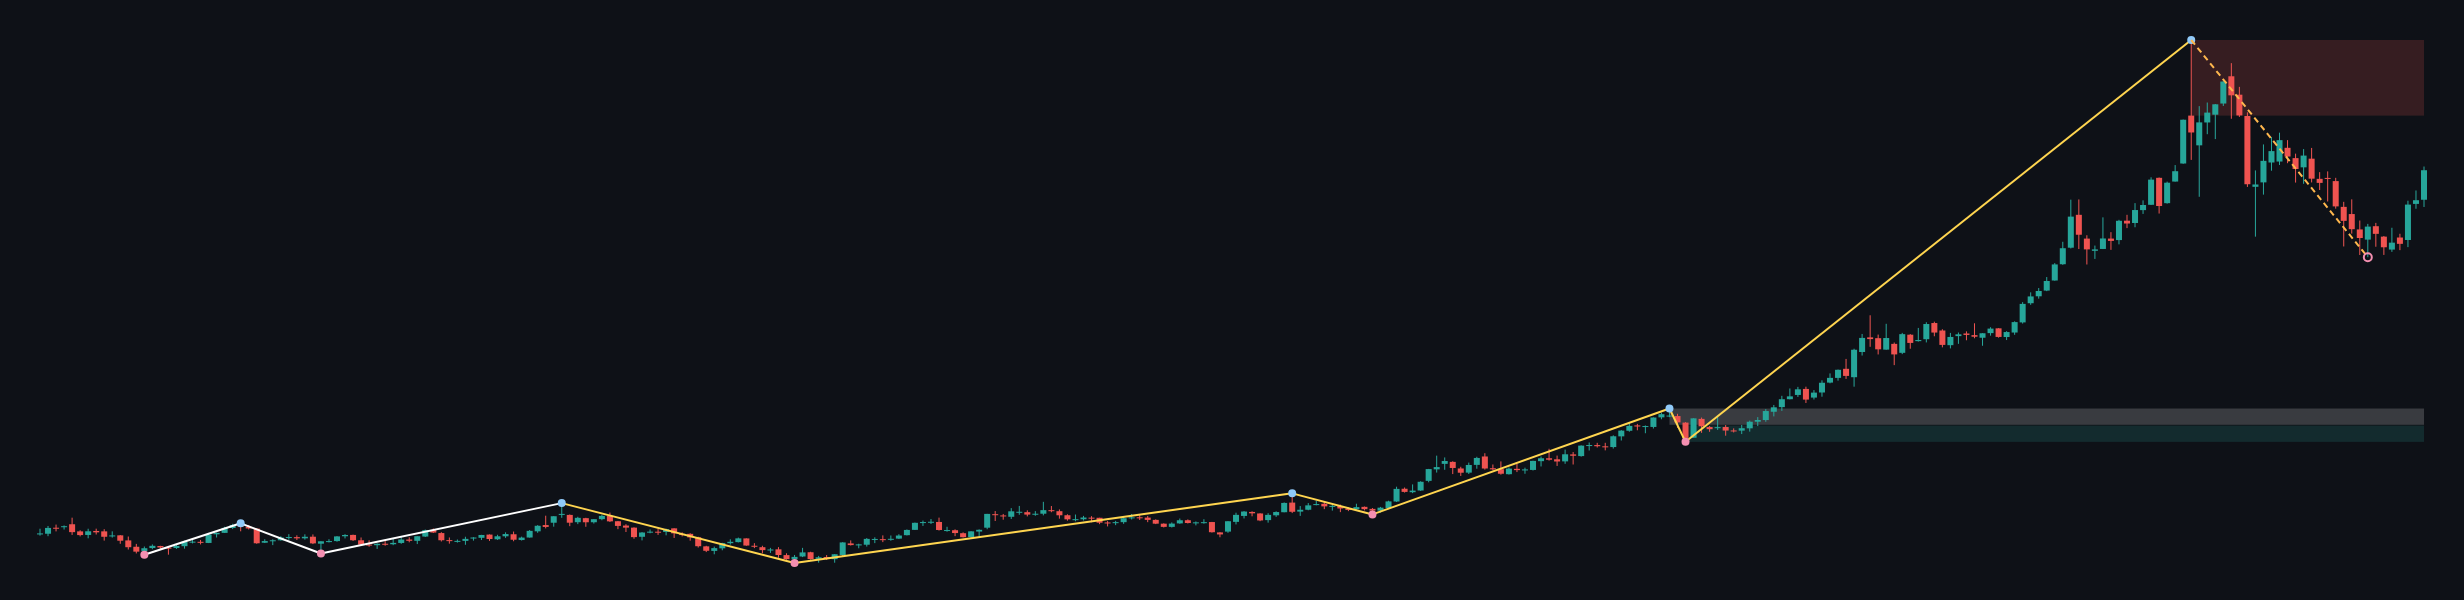
The higher timeframe permits further upside while price remains above the broader support structure, but the down weekly sub-trend means the area at 5019.871–5595.362 remains a material test rather than an assumed continuation point.
Main-frame structure
The daily trend is down and shaky, while the daily sub-trend is up. This misalignment can represent either a recovery within the prior decline or an early reversal attempt. The decisive structural reference is 4382.441: the report identifies a daily CHoCH at that level, and the current Fibonacci retracement ratio is 1.000, also corresponding to 4382.441.
The daily resistance zone at 4331.294–4382.441 has therefore changed character in the analysis. A sustained hold above it would support the recovery interpretation. A return below it would weaken the recent bullish shift and reopen the possibility of a move toward the daily support zone at 3942.138–4005.629. The separate broken-retest resistance zone at 4023.812–4067.640 sits within that broader lower structure.
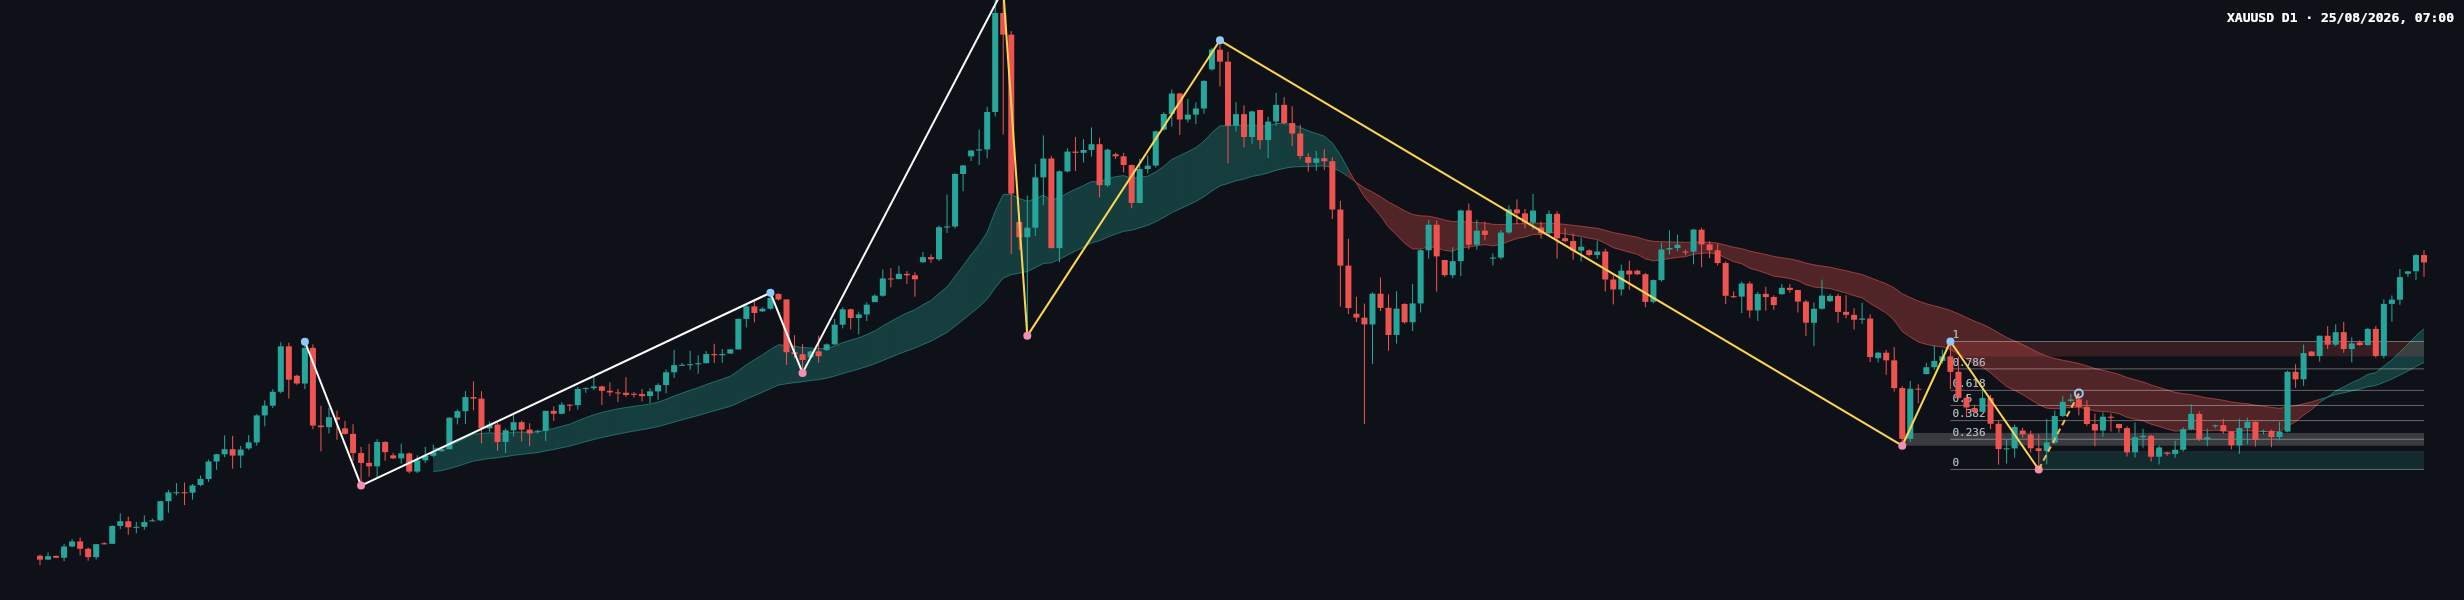
The latest completed Dow leg is mapped from 3942.138 to 4382.441. Its Fibonacci levels are 4046.050 at 0.236, 4110.334 at 0.382, 4162.290 at 0.5, 4214.245 at 0.618, and 4288.216 at 0.786. The current ratio of 1.000 shows that price has retraced the full measured leg to its upper anchor.
The daily EMA20 and EMA50 values are not included in the report and are not sufficiently determinable for precise numerical discussion. Visually, the recent recovery has improved the short-term structure, but the daily trend designation remains down and shaky until the area around 4382.441 proves durable.
Recent price action and closing candle
The visible sequence on the daily chart shows an extended decline toward the confirmed low at 3942.138, followed by a sharp rebound and consolidation around the Fibonacci references between 4023.812 and 4288.216. The subsequent advance carried price through the upper Fibonacci anchor at 4382.441.
The most recent candles show buyers regaining momentum after the base near 3942.138–4005.629. The latest visible candle is bullish in character and closes near the upper part of its recent advance, but the precise candle classification and exact wick proportions are not determinable from the report. Its practical meaning is constructive while price remains above 4382.441; rejection back into 4331.294–4382.441 would instead signal absorption or a failed breakout.
There is no volume or momentum reading in the deterministic report. The price-based evidence therefore takes priority: the CHoCH through 4382.441 supports the bullish recovery case, while the daily down-trend designation keeps the bearish reversal case active below that area.
Key levels
- 5019.871–5595.362: weekly resistance and the main higher-timeframe upside test.
- 4331.294–4382.441: daily resistance and the critical CHoCH retest area.
- 4288.216: Fibonacci 0.786 reference.
- 4214.245: Fibonacci 0.618 reference.
- 4162.290: Fibonacci 0.5 reference.
- 4110.334: Fibonacci 0.382 reference.
- 4046.050: Fibonacci 0.236 reference.
- 4023.812–4067.640: broken-retest resistance zone.
- 3942.138–4005.629: daily support zone and the area surrounding the confirmed low.
- 2536.779–2660.238 and 2666.640–2790.099: major weekly support zones.
Conditional scenarios
Bullish scenario
If price continues to hold above 4331.294–4382.441 after the CHoCH, the recovery structure remains valid. The next major area to observe is weekly resistance at 5019.871–5595.362. This scenario is invalidated by a decisive return below 4331.294, particularly if the retest fails across the full zone.
Bearish scenario
If price falls back below 4331.294–4382.441, the break through 4382.441 may prove temporary. The next lower areas to monitor would be the Fibonacci references at 4288.216, 4214.245, and 4162.290, followed by daily support at 3942.138–4005.629. This scenario is weakened if price reclaims and sustains above 4382.441.
Range and failed-break scenario
If price remains between the daily recovery boundary at 4331.294–4382.441 and the higher weekly resistance at 5019.871–5595.362, conditions may remain rotational rather than directional. A move below 3942.138 would invalidate the immediate recovery structure and shift attention to the broader weekly support zones at 2666.640–2790.099 and 2536.779–2660.238.
Session considerations
The cleanest technical information would come from observing whether a daily close holds above 4382.441 or returns beneath 4331.294. False breaks are possible around the CHoCH area, particularly when liquidity is thin or volatility expands. Traders should also account for DXY, US ten-year yields, the economic calendar, CPI, NFP, FOMC communications, Fed speakers, and geopolitical headlines. No event time window is provided in the report.
Asian, European, and US sessions can produce different volatility conditions in gold, with the latter often bringing the largest reaction to US data and yield moves. General risk principles remain important: use appropriately moderate exposure, define invalidation before acting, and avoid making decisions immediately before major economic releases. These are risk controls, not trade instructions.
Summary
- The weekly trend remains firmly up above 2536.779–2660.238 and 2666.640–2790.099, despite a down sub-trend from 5595.362.
- The daily chart has produced a CHoCH through 4382.441, with the current Fibonacci ratio at 1.000.
- Holding 4331.294–4382.441 would preserve the bullish recovery case toward 5019.871–5595.362.
- Failure below 4331.294–4382.441 would expose the Fibonacci ladder and daily support at 3942.138–4005.629.
The single most important thing today is whether the market can sustain acceptance above 4382.441 rather than merely trade above it temporarily.
Meta description: XAU/USD daily analysis: price holds above the 4382.441 CHoCH level while weekly resistance remains at 5019.871–5595.362.
This article is technical analysis and reference information only, not investment advice. Markets carry risk, and readers are responsible for their own decisions.