
XAU/USD closed at 4511.880 on the daily timeframe, holding above the former resistance area at 4331.294–4382.441. The weekly trend remains firmly upward, although its sub-trend is down, while the daily chart shows a shaky downtrend alongside an upward sub-trend. The key question is whether price can maintain acceptance above the daily broken level at 4382.441 or return into the former resistance zone.
| Metric | Reading |
|---|---|
| Most recent weekly close | 4375.817 |
| Most recent daily close | 4511.880 |
| Weekly trend | Up, firm; sub-trend down |
| Daily trend | Down, shaky; sub-trend up |
| Daily structure | CHoCH at 4382.441 |
| Nearest daily resistance | 4331.294–4382.441, now a broken-retest zone |
| Nearest daily support | 4023.812–4068.764, broken-retest zone |
| Active Fibonacci reading | Current retracement ratio 1.000 |
Higher-timeframe context
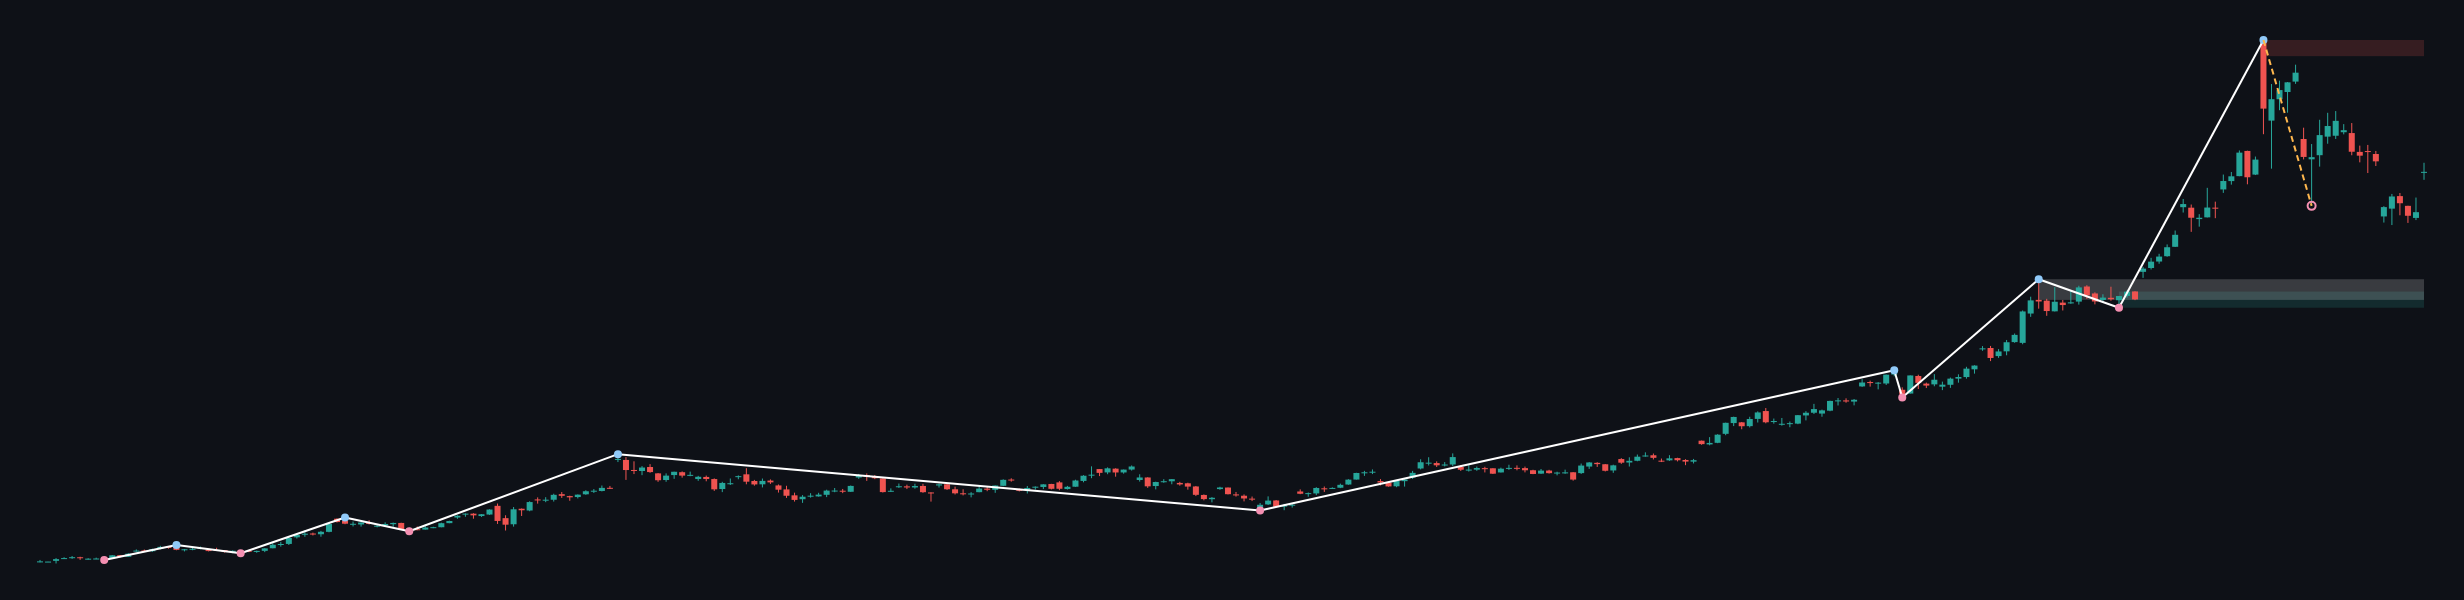
The weekly chart continues to define the directional framework. Its main trend is up and described as firm, while the sub-trend is down. No weekly structure event is recorded, so the larger bullish structure has not been formally invalidated by the latest pullback. The most recent confirmed weekly swing is the high at 5450.970.
Weekly price is currently above the broken-retest support zone at 3331.873–3500.057 and above the broader support zone at 3268.058–3399.325. The major weekly resistance area is 5319.703–5450.970. These zones frame the larger market: the lower areas represent historical demand and the upper area is the principal supply reference. The weekly ATR is 262.534, indicating that broad swings can remain substantial.
The weekly report does not provide numerical moving-average values or a weekly Fibonacci reading. Those details are therefore not determinable from the deterministic data report. The higher timeframe permits continued bullish scenarios while price holds above the larger support structure, but the down sub-trend means that resistance reactions remain relevant.
Main-frame structure
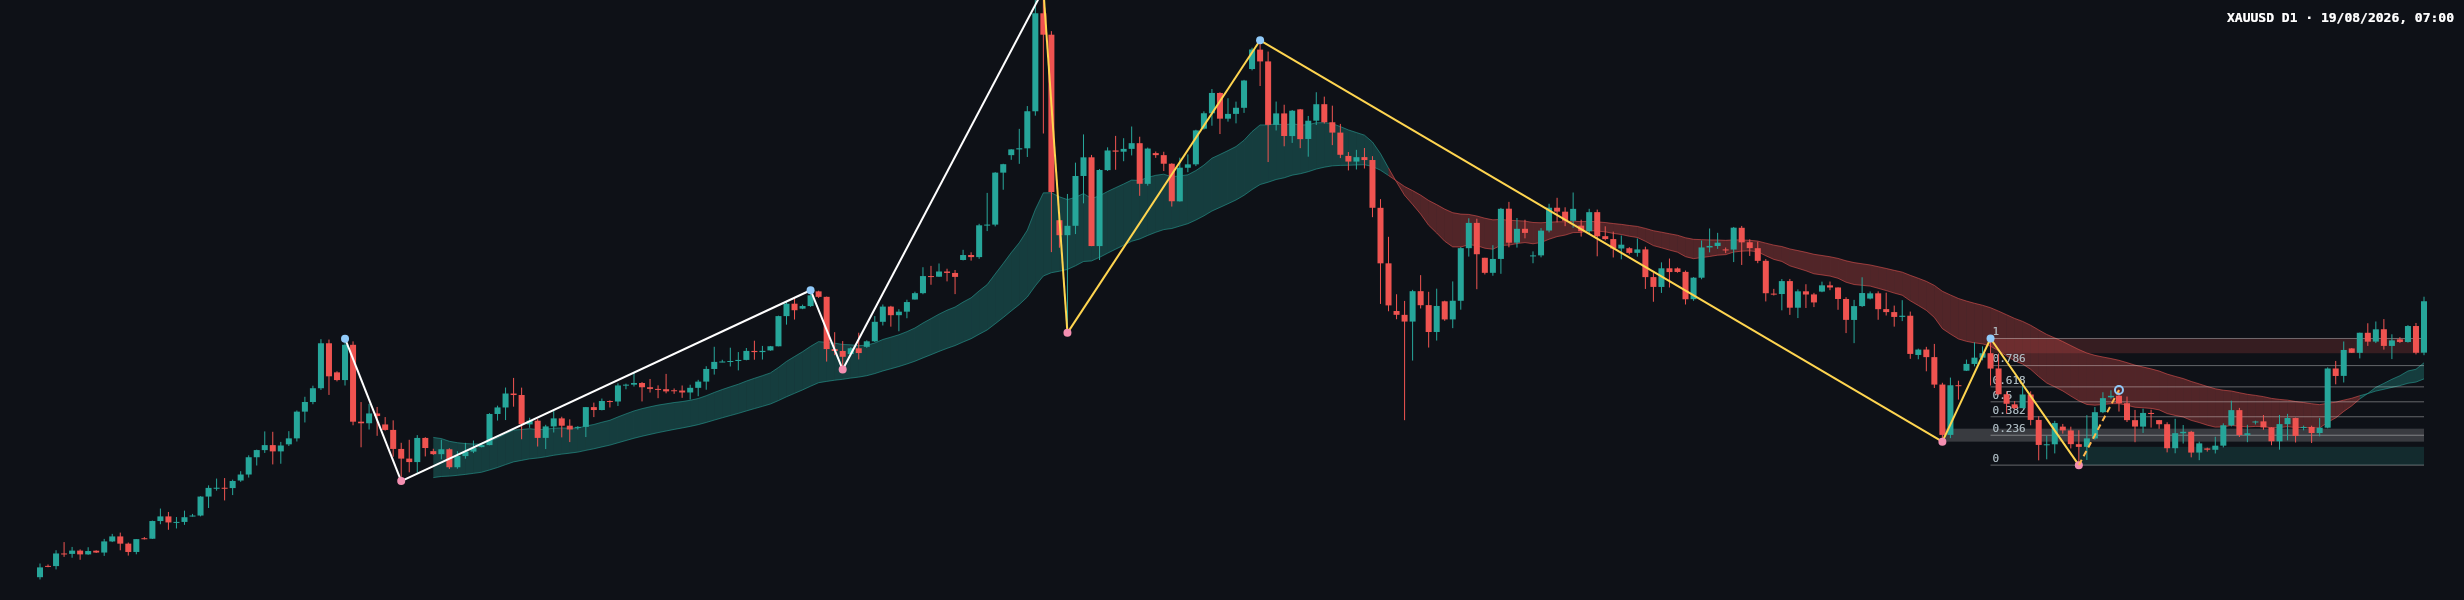
The daily chart is more conflicted than the weekly chart. Its main trend is down, although the trend is shaky, and its sub-trend is up. This creates a potential pullback within a broader daily decline, while the recorded CHoCH at 4382.441 also provides an early reversal signal. The distinction will depend on whether price remains above the broken daily level or loses the surrounding resistance zone.
The daily resistance zone is 4331.294–4382.441. Since the latest close is 4511.880, price is currently positioned above that area. The daily support zone is 3942.138–4005.629, with a separate broken-retest resistance zone at 4023.812–4068.764. The most recent confirmed daily swing is the low at 3942.138.
The latest completed Dow leg is mapped from 3942.138 to 4382.441. Its Fibonacci levels are 0.236 at 4046.050, 0.382 at 4110.334, 0.5 at 4162.290, 0.618 at 4214.245, and 0.786 at 4288.216. The current retracement ratio is 1.000, corresponding to the upper endpoint at 4382.441. Price has therefore recovered through the full marked leg rather than remaining within a partial retracement band.
The daily ATR is 89.903. The chart shows a transition from a red moving-average ribbon during the decline toward a more constructive configuration after the recovery, but the report does not provide numerical moving-average values, crossover readings, or volume data. The exact candle-by-candle range comparison is consequently not determinable from the report.
Key levels and closing-candle read
The most important daily reference is 4382.441, the broken level associated with the CHoCH. The surrounding zone at 4331.294–4382.441 is the first area that would need to hold if the recovery is to remain structurally constructive. A return below that zone would weaken the bullish interpretation and refocus attention on 4023.812–4068.764, followed by 3942.138–4005.629.
The closing price at 4511.880 is above the daily resistance zone. The deterministic report does not classify the last candle by type or specify its body, wick, or closing position within its range, so a precise candle label is not determinable. From a structural perspective, the close confirms that price is currently holding above 4382.441; follow-through or a failed retest would provide more information than the close alone.
Conditional scenarios
- Primary bullish scenario: If price continues to hold above 4382.441 and sustains acceptance above 4331.294–4382.441, the daily CHoCH can develop into a broader recovery. The next major higher-timeframe reference is the weekly resistance zone at 5319.703–5450.970. This scenario is invalidated if price returns below the daily zone and fails to reclaim 4382.441. On the available structure, this is the favored scenario while the latest close remains above the broken level.
- Secondary range scenario: If price remains above 4331.294–4382.441 but cannot extend toward 5319.703–5450.970, consolidation between the broken daily zone and the current elevated area is possible. This scenario is invalidated by decisive acceptance below 4331.294 or by a clear continuation toward the weekly resistance zone.
- Bearish risk scenario: If price falls back through 4331.294–4382.441, the CHoCH would lose credibility and the daily downtrend could regain control. The next lower references are 4023.812–4068.764 and then 3942.138–4005.629. This scenario is invalidated by a sustained recovery above 4382.441.
What to monitor
- Resistance: monitor 4331.294–4382.441 as the immediate structural zone and 5319.703–5450.970 as the major weekly supply area.
- Support: monitor 4023.812–4068.764 and 3942.138–4005.629 if the daily recovery fails.
- Confirmation: the bullish case needs continued holding above 4382.441; the bearish case needs acceptance back below 4331.294.
- Fibonacci: the marked levels from 4046.050 through 4288.216 remain useful references inside the lower daily structure, while the current retracement ratio is 1.000.
- Market risks: false breakouts and liquidity sweeps can occur around the broken-retest zone. DXY, US ten-year yields, the economic calendar, CPI, NFP, FOMC communication, Fed speakers, and geopolitical headlines can all affect gold volatility. No exact event time is provided in the report.
- Risk discipline: readers should consider exposure carefully, avoid decisions based on a single candle, and account for the daily ATR of 89.903 and weekly ATR of 262.534. This is scenario analysis, not an instruction to enter or exit a position.
Summary
- The weekly main trend is firmly up, with no recorded weekly structure event.
- The daily chart remains a shaky downtrend with an upward sub-trend and a CHoCH at 4382.441.
- The latest daily close at 4511.880 is above 4331.294–4382.441, keeping the recovery scenario active.
- A move back below 4331.294–4382.441 would shift attention toward 4023.812–4068.764 and 3942.138–4005.629.
The single most important thing today is whether price can maintain acceptance above 4382.441 rather than falling back into the daily broken-retest zone.
#XAUUSD #Gold #TechnicalAnalysis #PriceAction #DailyAnalysis
Meta description: XAU/USD analysis covering weekly context, daily CHoCH, key zones, Fibonacci levels, and conditional bullish and bearish scenarios.
This article is technical analysis and reference information only, not investment advice. Markets carry risk, and readers are responsible for their own decisions.