
XAU/USD presents a mixed multi-timeframe picture. The weekly trend remains firmly upward, with the latest closed price at 4375.817, while the daily trend is still down but showing an upward sub-trend. On the main frame, price has moved above the broken level at 4382.441, creating a conditional recovery case rather than a fully established reversal.
Higher-timeframe context
The weekly chart continues to favor the buyers while price holds above the broader support zones at 3268.058–3399.325 and 3331.873–3500.057. The latter is marked as a broken-retest area, so a renewed move into that zone would be an important test of whether the longer-term structure remains constructive.
The weekly main trend is up and described as firm, although the sub-trend is down. There is no reported weekly structure event. The most recent confirmed weekly swing is the high at 5450.970, with the broader resistance zone located at 5319.703–5450.970. Price is therefore below major weekly resistance and above the reported weekly support areas, rather than trading in open space without reference points.
The weekly moving-average position, spacing and crossover status are not determinable from the supplied numerical report. Weekly Fibonacci interaction is also not specified, so no weekly ratio should be inferred from the image alone. The weekly ATR is 262.534, indicating a wider higher-timeframe price environment than the daily ATR.
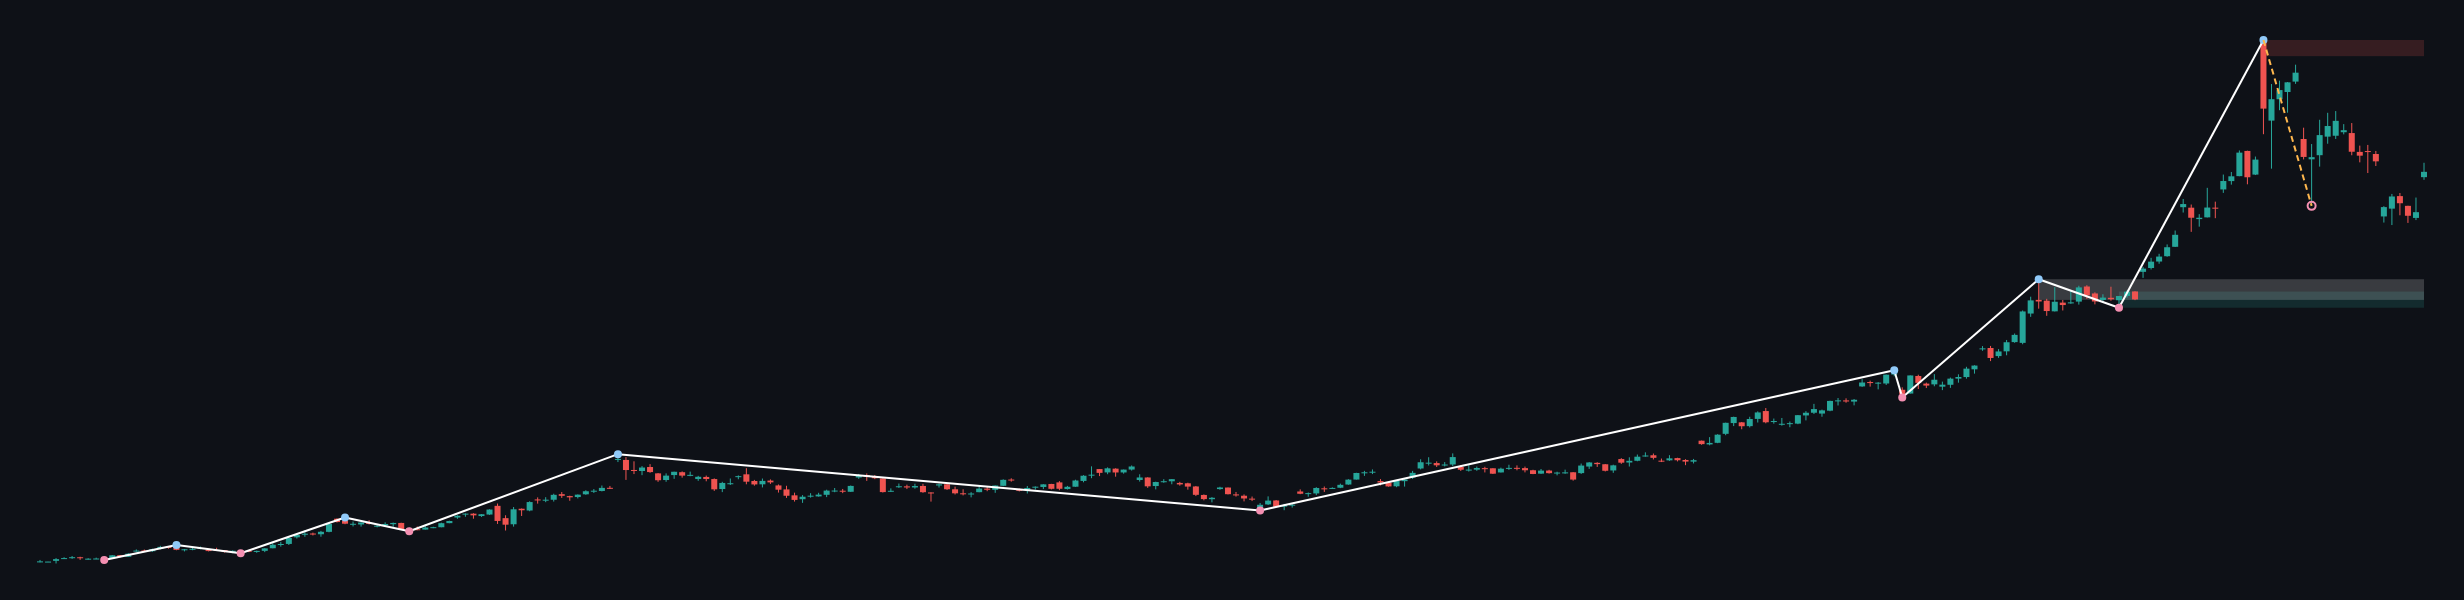
The higher-timeframe conclusion is conditional: the weekly structure permits further upside while the support zones remain respected, but the down sub-trend and the resistance area at 5319.703–5450.970 leave room for consolidation or rejection.
Main-frame structure
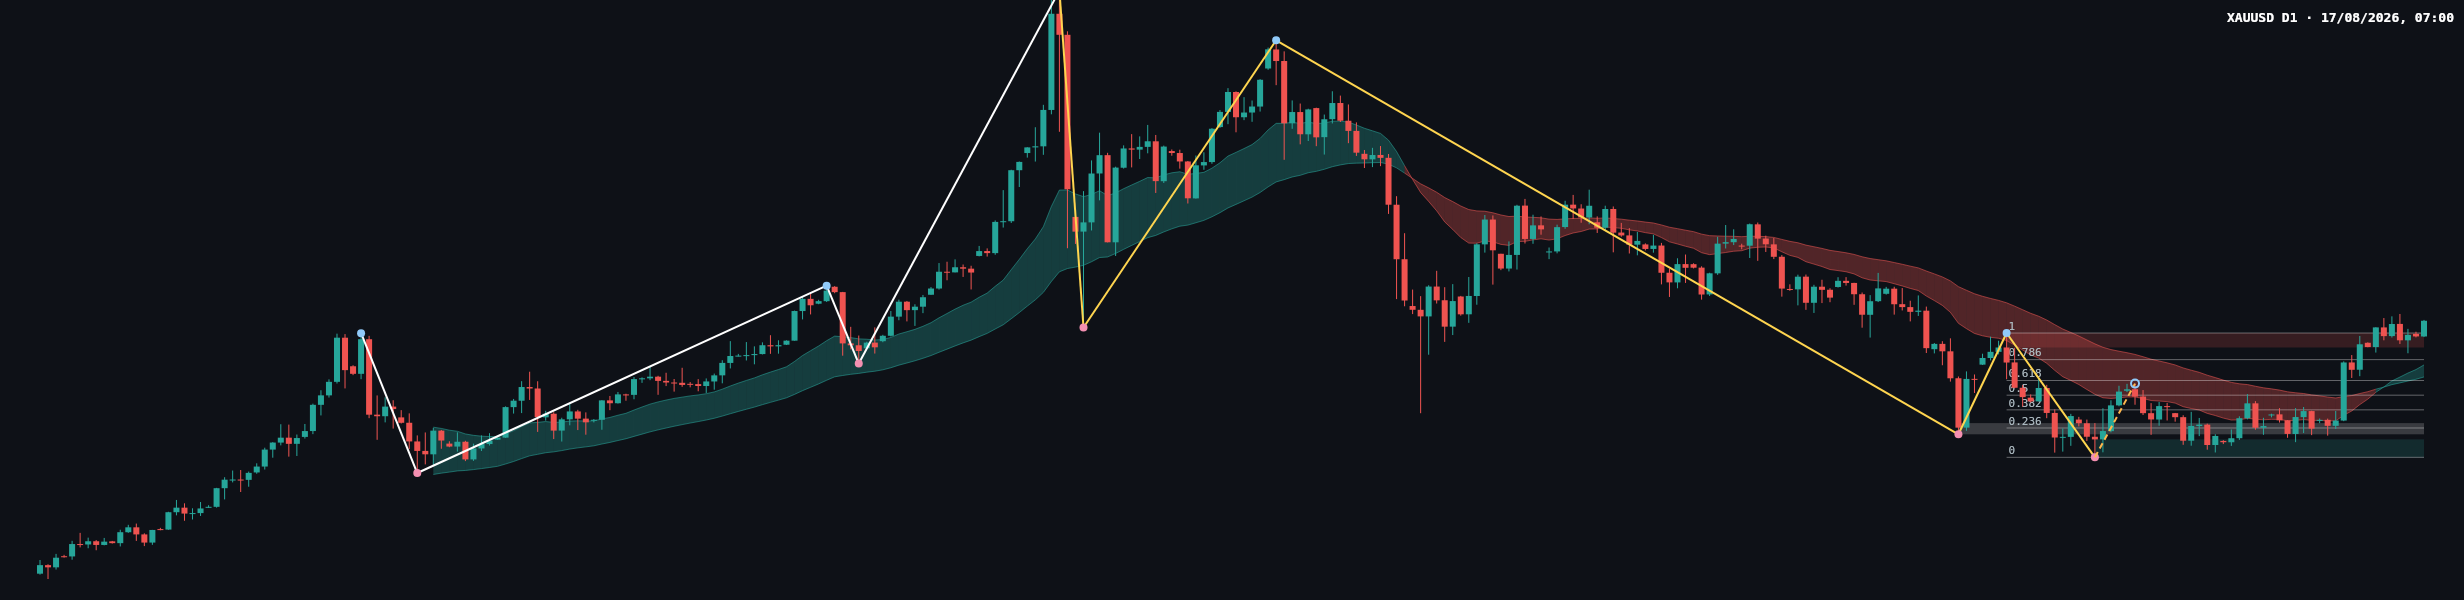
On the daily chart, the main trend is down but shaky, while the sub-trend is up. This does not fully align with the weekly trend; it can be read as an early reversal attempt within a previously weaker daily structure. The reported structure event is a CHoCH after the level at 4382.441 was broken.
The daily resistance zone at 4331.294–4382.441 is now the central reference area. The latest closed price, 4425.772, is above that zone, which supports the bullish case only if the market can maintain acceptance above it. The next reported upside reference is the weekly resistance zone at 5319.703–5450.970; this is a higher-timeframe area, not an immediate forecast.
Below the market, the daily support zone is 3942.138–4005.629, with the most recent confirmed daily swing low at 3942.138. A second daily resistance area at 4023.812–4063.333 is marked as a broken-retest zone, although it is below the current closing price and is therefore a historical structure reference rather than the nearest overhead barrier.
The daily ATR is 79.042. The daily moving-average values, slopes and crossover status are not determinable from the numerical report. The chart does show a changing moving-average envelope, but the supplied data does not permit a precise claim about its values or spacing.
Key levels and Fibonacci map
| Reference | Level or zone | Role |
|---|---|---|
| Daily close | 4425.772 | Current closing reference |
| Daily broken level | 4382.441 | CHoCH level and upper boundary of daily resistance |
| Daily resistance | 4331.294–4382.441 | Retest area for the recovery structure |
| Daily support | 3942.138–4005.629 | Primary lower structural demand zone |
| Daily Fibonacci | 0.236 at 4046.050; 0.382 at 4110.334; 0.5 at 4162.290; 0.618 at 4214.245; 0.786 at 4288.216; 1.000 at 4382.441 | Latest completed Dow leg |
The current retracement ratio is 1.000, corresponding to 4382.441. Since the latest close is above that level, the market is testing whether the prior leg’s endpoint can become a durable support reference. A move back below the Fibonacci ladder would progressively expose the lower retracement references, with 4288.216, 4214.245 and 4162.290 providing intermediate structural checkpoints.
Scenarios
Bullish continuation
If price holds above the daily resistance zone at 4331.294–4382.441 and continues to close above 4382.441, the CHoCH would receive confirmation through sustained acceptance. The next broader upside reference would be the weekly resistance zone at 5319.703–5450.970. This scenario is invalidated if price loses the 4331.294–4382.441 zone and fails to reclaim it.
Bearish rejection
If price is rejected from 4331.294–4382.441 and closes back below 4382.441, the apparent daily recovery would weaken. The Fibonacci references at 4288.216, 4214.245 and 4162.290 would then become relevant downside checkpoints. This scenario is invalidated by sustained acceptance above 4382.441.
Deeper corrective move
If selling pressure extends through the Fibonacci checkpoints and price approaches the daily support zone at 3942.138–4005.629, the market would be revisiting the area surrounding the most recent confirmed daily swing low at 3942.138. A decisive loss of that support zone would weaken the daily recovery thesis further. This scenario is invalidated if price remains above 4382.441 and builds acceptance above the former resistance area.
Estimated scenario probabilities are not determinable from the supplied report. The directional bias therefore remains conditional, with the daily chart leaning constructive only while 4382.441 is defended.
Key considerations for the session
- Resistance: monitor 4331.294–4382.441 as the nearest daily structure zone and 5319.703–5450.970 as the major weekly resistance area.
- Support: monitor the Fibonacci references at 4288.216, 4214.245 and 4162.290, followed by the daily support zone at 3942.138–4005.629.
- Confirmation: a daily close above 4382.441 followed by a successful retest would support continuation; a close back below the same level would favor rejection.
- Traps: false breaks around 4382.441, liquidity sweeps into 4331.294–4382.441, and sharp session volatility can produce misleading intraday signals.
- Fundamentals: monitor DXY, US Treasury yields, CPI, NFP, FOMC communication, Fed speakers and geopolitical headlines. No exact event time or scheduled major release is supplied in the report.
- Risk principles: traders should account for the daily ATR of 79.042 and weekly ATR of 262.534, avoid relying on a single candle, and consider the risks of acting immediately before major news.
Asian trading may remain more rotational around the established levels, while European and US activity can bring greater volatility and more decisive tests of 4382.441. These are general session tendencies, not forecasts.
Summary
- The weekly trend is firmly up, but its sub-trend is down and price remains below 5319.703–5450.970.
- The daily trend is down but shaky, with an upward sub-trend and a reported CHoCH at 4382.441.
- The latest daily close at 4425.772 is above 4331.294–4382.441, keeping the recovery scenario active.
- A return below 4382.441 would shift attention toward 4288.216, 4214.245 and the support zone at 3942.138–4005.629.
The single most important thing today is whether price can sustain acceptance above 4382.441 after the daily CHoCH.
Meta description: XAU/USD daily analysis: gold trades above 4382.441 after a CHoCH, with weekly strength contrasting with a shaky daily downtrend.
This article is technical analysis and reference information only, not investment advice. Markets carry risk, and readers are responsible for their own decisions.