
XAU/USD đang giao dịch tại một điểm giao cắt kỹ thuật mang tính quyết định. Cấu trúc khung thời gian cao hơn vẫn vững chắc theo hướng tăng, nhưng xu hướng phụ của nó đang giảm; trên biểu đồ hàng ngày, xu hướng tổng thể đang giảm và thiếu ổn định, trong khi xu hướng phụ đã chuyển sang tăng. Diễn biến đáng chú ý nhất là CHoCH hàng ngày gắn với mức đã bị phá vỡ tại 4382.441, trong khi giá đóng cửa gần nhất ở 4402.303 vẫn duy trì trên mốc tham chiếu đó.
| Chỉ số | Giá trị |
|---|---|
| Giá đóng cửa gần nhất của khung chính | 4402.303 |
| Giá đóng cửa gần nhất hàng tuần | 4342.514 |
| Xu hướng hàng tuần | Tăng, vững chắc; xu hướng phụ giảm |
| Xu hướng hàng ngày | Giảm, thiếu ổn định; xu hướng phụ tăng |
| Cấu trúc hàng ngày | CHoCH tại 4382.441 |
| zone kháng cự hàng ngày gần nhất | 4331.294 – 4382.441 |
| zone hỗ trợ hàng ngày | 3942.138 – 4005.629 |
| Mức Fibonacci retracement hiện tại | 1.000 |
Bối cảnh khung thời gian cao hơn
Biểu đồ hàng tuần cung cấp một khung định hướng mang tính xây dựng. Xu hướng chính của nó là tăng và được mô tả là vững chắc, trong khi xu hướng phụ đang giảm. Không có sự kiện cấu trúc hàng tuần nào được ghi nhận, vì vậy cấu trúc tăng lớn hơn chưa bị vô hiệu hóa một cách chính thức bởi dữ liệu hiện có. swing hàng tuần được xác nhận gần nhất là một đỉnh tại 5595.362.
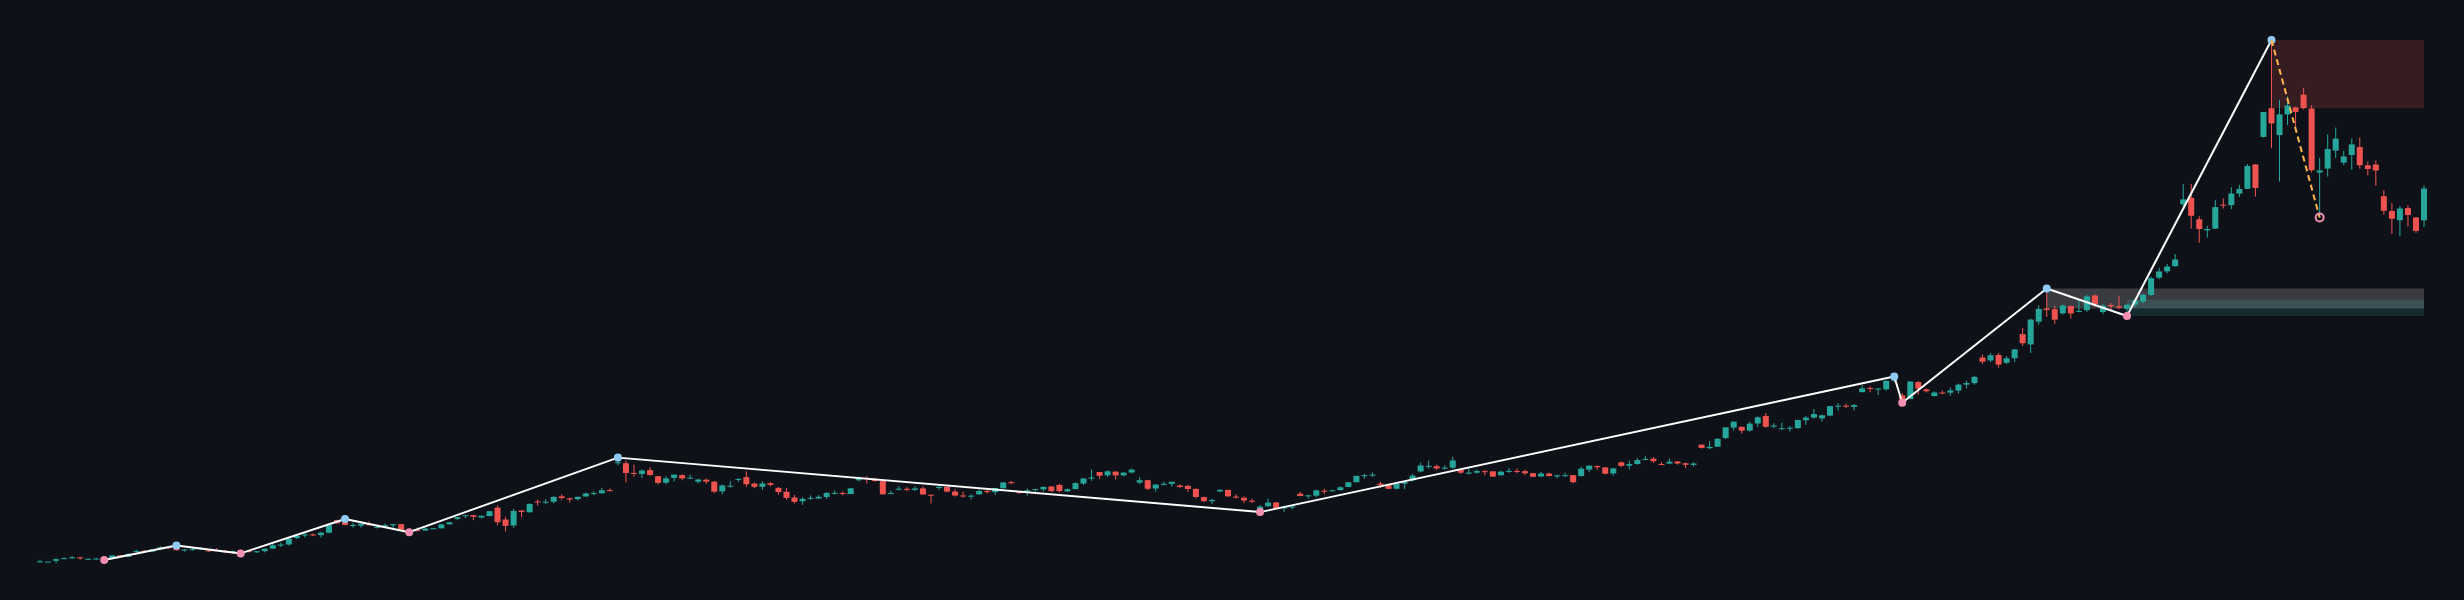
Hỗ trợ hàng tuần được xác định tại 3268.058 – 3405.143. zone hàng tuần thứ hai tại 3331.873 – 3500.057 được đánh dấu là vùng broken-retest. Phía trên thị trường, kháng cự hàng tuần nằm tại 5019.871 – 5595.362. ATR hàng tuần là 274.171, cho thấy khung lớn hơn cho phép biến động rộng hơn đáng kể so với những gì riêng cấu trúc hàng ngày gợi ý.
Do đó, giá đang nằm trên các vùng hỗ trợ hàng tuần đã nêu và dưới zone kháng cự hàng tuần lớn. Khung thời gian cao hơn cho phép tiếp tục tăng trong khi 4382.441 vẫn được chấp nhận là mốc tham chiếu hàng ngày đã được lấy lại, nhưng xu hướng phụ hàng tuần giảm cảnh báo rằng đà phục hồi vẫn đang diễn ra bên trong một pha điều chỉnh.
Cấu trúc khung chính
Xu hướng hàng ngày đang giảm và thiếu ổn định, không hoàn toàn phù hợp với xu hướng tăng hàng tuần vững chắc. Xu hướng phụ hàng ngày đang tăng, và CHoCH được ghi nhận tại 4382.441 cung cấp bằng chứng rằng chuỗi giảm trước đó đã suy yếu. Đây có thể là tín hiệu đảo chiều sớm trên khung hàng ngày, mặc dù nó chưa giống với một thay đổi xu hướng khung thời gian cao hơn được xác nhận.
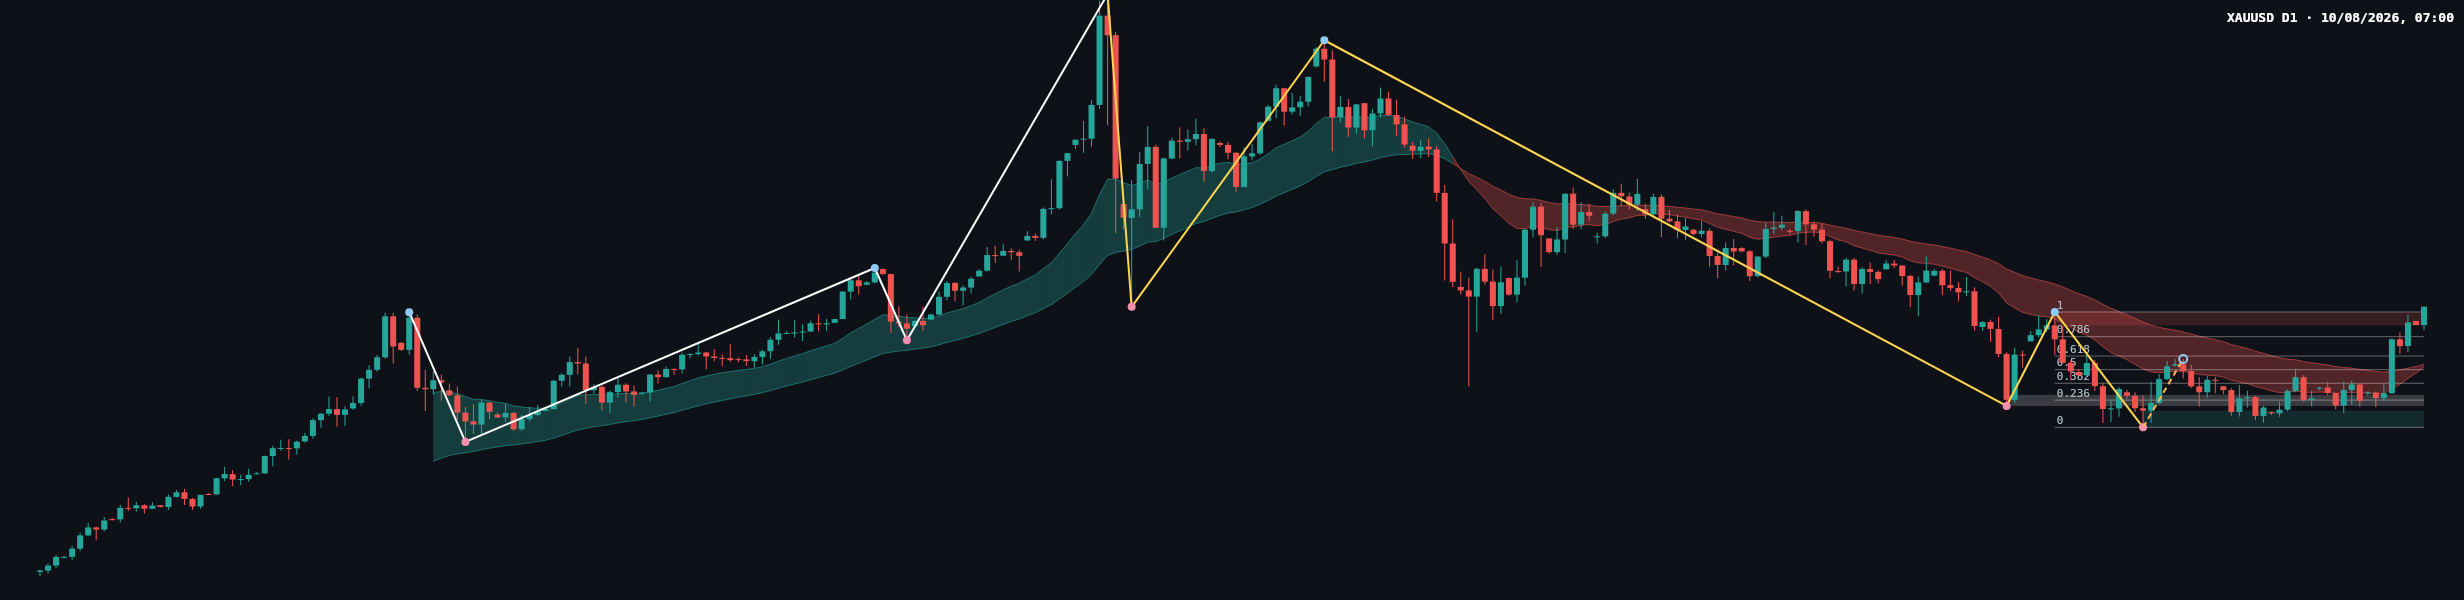
zone kháng cự hàng ngày là 4331.294 – 4382.441. Vì giá đóng cửa gần nhất là 4402.303, giá hiện đang nằm trên zone này thay vì bên dưới nó. Điều đó khiến khu vực này trở thành một mốc tham chiếu retest tiềm năng: việc tiếp tục được chấp nhận trên 4382.441 sẽ hỗ trợ cách diễn giải tăng, trong khi việc quay trở lại dưới zone sẽ làm suy yếu cách diễn giải đó.
zone hỗ trợ hàng ngày chính là 3942.138 – 4005.629. swing hàng ngày được xác nhận gần nhất là một đáy tại 3942.138. Một vùng kháng cự khác, được đánh dấu là broken-retest, là 4023.812 – 4066.046. ATR hàng ngày là 84.469, vì vậy các phản ứng quanh những zone được liệt kê có thể đáng kể nhưng không hàm ý một hướng đi cụ thể trong tương lai.
Các mức quan trọng và bản đồ Fibonacci
Dow leg hoàn tất gần nhất được lập bản đồ từ 3942.138 đến 4382.441. Các mức Fibonacci được liệt kê là:
- 0: 3942.138
- 0.236: 4046.050
- 0.382: 4110.334
- 0.5: 4162.290
- 0.618: 4214.245
- 0.786: 4288.216
- 1: 4382.441
Tỷ lệ retracement hiện tại là 1.000, đưa mốc tham chiếu gần nhất đến điểm đầu trên của Dow leg hoàn tất này. Do đó, ranh giới phân định thực tế là 4382.441. Phía trên mức này, đà phục hồi hàng ngày vẫn được cấu trúc hỗ trợ; phía dưới mức này, sự chú ý quay lại cấu trúc Fibonacci và vùng hỗ trợ hàng ngày tại 3942.138 – 4005.629.
Các kịch bản
Kịch bản tiếp diễn tăng
Nếu giá tiếp tục duy trì trên 4382.441, CHoCH hàng ngày vẫn có hiệu lực và đà phục hồi có thể được đánh giá là một nỗ lực mở rộng hướng tới zone kháng cự hàng tuần tại 5019.871 – 5595.362. Kịch bản này bị vô hiệu hóa bởi việc giá duy trì quay trở lại dưới 4382.441, đặc biệt nếu chuyển động đó đi kèm sự từ chối từ zone kháng cự hàng ngày trước đây.
Kịch bản từ chối giảm
Nếu giá giảm trở lại dưới 4382.441 và không thể lấy lại mức này, CHoCH sẽ mất đi sự xác nhận thực tế. Vùng giảm rộng hơn tiếp theo cần theo dõi sẽ là zone hỗ trợ hàng ngày tại 3942.138 – 4005.629. Kịch bản này bị vô hiệu hóa bởi việc chấp nhận trở lại trên 4382.441 và các lần đóng cửa tiếp tục trên dải kháng cự tại 4331.294 – 4382.441.
Kịch bản đi ngang và phá vỡ thất bại
Giá cũng có thể dao động quanh ranh giới được hình thành bởi 4331.294 – 4382.441 mà chưa ngay lập tức phát triển động lực tiếp diễn theo hướng cụ thể. Một chuyển động trên 4382.441 nhanh chóng quay trở lại zone sẽ cảnh báo về một pha phá vỡ tăng thất bại; một chuyển động xuống dưới zone nhanh chóng phục hồi lên trên 4382.441 thay vào đó sẽ cảnh báo về một pha quét thanh khoản giảm. Mốc vô hiệu hóa liên quan là phía của zone mà giá lấy lại thành công.
Điều cần theo dõi
- Quan sát xem 4382.441 hoạt động như hỗ trợ được chấp nhận hay trở lại thành kháng cự.
- Theo dõi các phản ứng trên 4331.294 – 4382.441, zone kháng cự hàng ngày gần nhất.
- Tiếp tục lưu ý vùng hỗ trợ rộng hơn tại 3942.138 – 4005.629 nếu đà phục hồi hàng ngày thất bại.
- Sử dụng các mốc tham chiếu Fibonacci từ 4046.050 đến 4382.441 để đánh giá liệu một pullback có diễn ra trật tự hay gây tổn hại về cấu trúc.
- So sánh hành động giá hàng ngày với zone kháng cự hàng tuần tại 5019.871 – 5595.362 thay vì xem CHoCH hàng ngày là một sự đảo chiều hàng tuần hoàn chỉnh.
Báo cáo mang tính xác định này không cung cấp đủ thông tin để phân loại chính xác nến gần nhất là pin bar, nến engulfing, doji hay một mô hình có tên gọi khác. Báo cáo cũng không cung cấp các giá trị EMA hàng ngày, số liệu khối lượng, thước đo động lượng hoặc thay đổi số học của phiên trước. Vì vậy, không nên suy luận những chi tiết đó. Các quan sát đáng tin cậy là giá đóng cửa gần nhất tại 4402.303, vị trí của nó trên 4382.441 và CHoCH hàng ngày đã được ghi nhận.
Kết luận
Cấu trúc hàng tuần ủng hộ cách diễn giải mang tính xây dựng, nhưng xu hướng phụ hàng tuần giảm và xu hướng chính hàng ngày giảm khiến thị trường vẫn ở trạng thái chuyển tiếp. Trường hợp tăng hàng ngày phụ thuộc vào việc chấp nhận trên 4382.441; thất bại tại đó sẽ chuyển sự chú ý về 4331.294 – 4382.441 và, nếu sự suy yếu tiếp diễn, về 3942.138 – 4005.629. Vấn đề quan trọng nhất là liệu mức hàng ngày đã được lấy lại có tiếp tục được hỗ trợ hay trở thành mốc tham chiếu của một pha breakout thất bại.
Bài viết này chỉ nhằm mục đích phân tích kỹ thuật và cung cấp thông tin tham khảo, không phải lời khuyên đầu tư. Thị trường luôn tiềm ẩn rủi ro và độc giả tự chịu trách nhiệm về các quyết định của mình.