
XAU/USD đang giao dịch tại một vùng quyết định quan trọng. Giá đóng cửa daily gần nhất là 4332.699, trong khi giá đóng cửa weekly là 4342.514. Giá đang tiến vào vùng resistance daily tại 4331.294–4382.441 sau khi phục hồi từ vùng support daily tại 3942.138–4005.629. Đặc điểm đáng chú ý là sự xung đột giữa xu hướng tăng weekly vững chắc và xu hướng giảm daily vững chắc, trong khi sub-trend daily hiện đang tăng.
| Chỉ số | Giá trị |
|---|---|
| Giá đóng cửa gần nhất Daily | 4332.699 |
| Giá đóng cửa gần nhất Weekly | 4342.514 |
| Xu hướng Weekly | Tăng, vững chắc |
| Xu hướng Daily | Giảm, vững chắc; sub-trend tăng |
| Resistance gần nhất | 4331.294–4382.441 |
| Support gần nhất | 3942.138–4005.629 |
| Thông tin Fibonacci đang hoạt động | Tỷ lệ retracement hiện tại 0.887; nhịp gần nhất kết thúc tại 4382.441 |
| ATR Daily | 84.085 |
Bối cảnh khung thời gian cao hơn: Weekly
Cấu trúc weekly vẫn bullish, với xu hướng chính được phân loại là tăng và vững chắc. swing được xác nhận gần nhất là một đỉnh tại 5450.970, và không có sự kiện cấu trúc weekly nào được báo cáo. Sự kết hợp này duy trì khung định hướng lớn mang tính tích cực, dù sub-trend weekly đang giảm và do đó cảnh báo rằng thị trường đang trải qua một nhịp đi ngược trong xu hướng tăng rộng hơn.
Giá không nằm trong vùng trống trên biểu đồ weekly. Giá đóng cửa weekly gần nhất tại 4342.514 nằm giữa các vùng support và resistance của khung thời gian cao hơn, với vùng support broken-retest tại 3331.873–3500.057 và vùng support rộng hơn tại 3268.058–3395.159. Phía trên thị trường, vùng resistance weekly chính là 5323.869–5450.970. ATR weekly là 254.202, vì vậy các vùng của khung thời gian cao hơn rộng hơn đáng kể so với vùng quyết định daily.
Báo cáo không cung cấp các giá trị số có thể đọc được cho các đường EMA weekly, khoảng cách giữa chúng hoặc bất kỳ crossover nào. Do đó, mối quan hệ chính xác của chúng không thể được xác định từ dữ liệu được cung cấp. Các giá trị Fibonacci weekly cũng không được liệt kê, nên không thể xác định tương tác với một tỷ lệ Fibonacci weekly cụ thể.
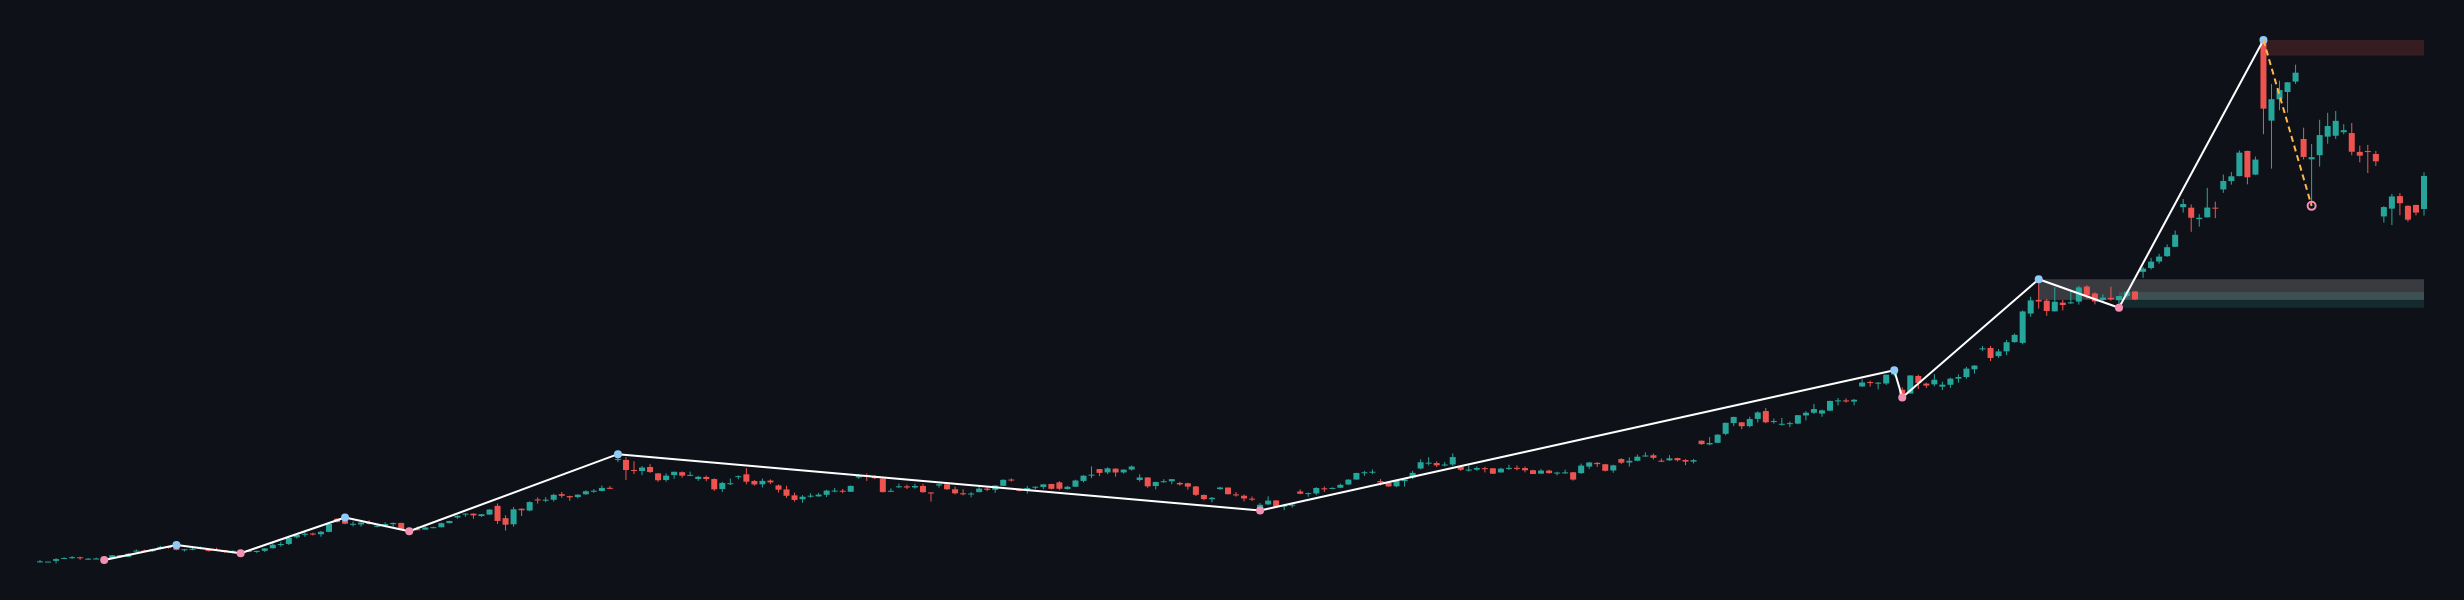
Kết luận Weekly: Khung thời gian cao hơn cho phép tiếp tục tăng khi giá vẫn nằm trên các vùng support weekly, nhưng sub-trend weekly và resistance tại 5323.869–5450.970 vẫn để ngỏ khả năng xuất hiện một pha điều chỉnh trước bất kỳ sự tiếp diễn nào.
Cấu trúc khung chính: Daily
Xu hướng chính daily đang giảm và vững chắc, trong khi sub-trend đang tăng. Điều này không đồng nhất với hướng đi của weekly. Hiện tại, đợt phục hồi daily tốt nhất nên được xem là một pullback hoặc nhịp tăng ngược xu hướng, trừ khi giá tạo ra một thay đổi cấu trúc được xác nhận. Không có sự kiện cấu trúc daily nào được báo cáo, vì vậy không có BOS hoặc CHoCH nào được xác nhận trong dữ liệu xác định.
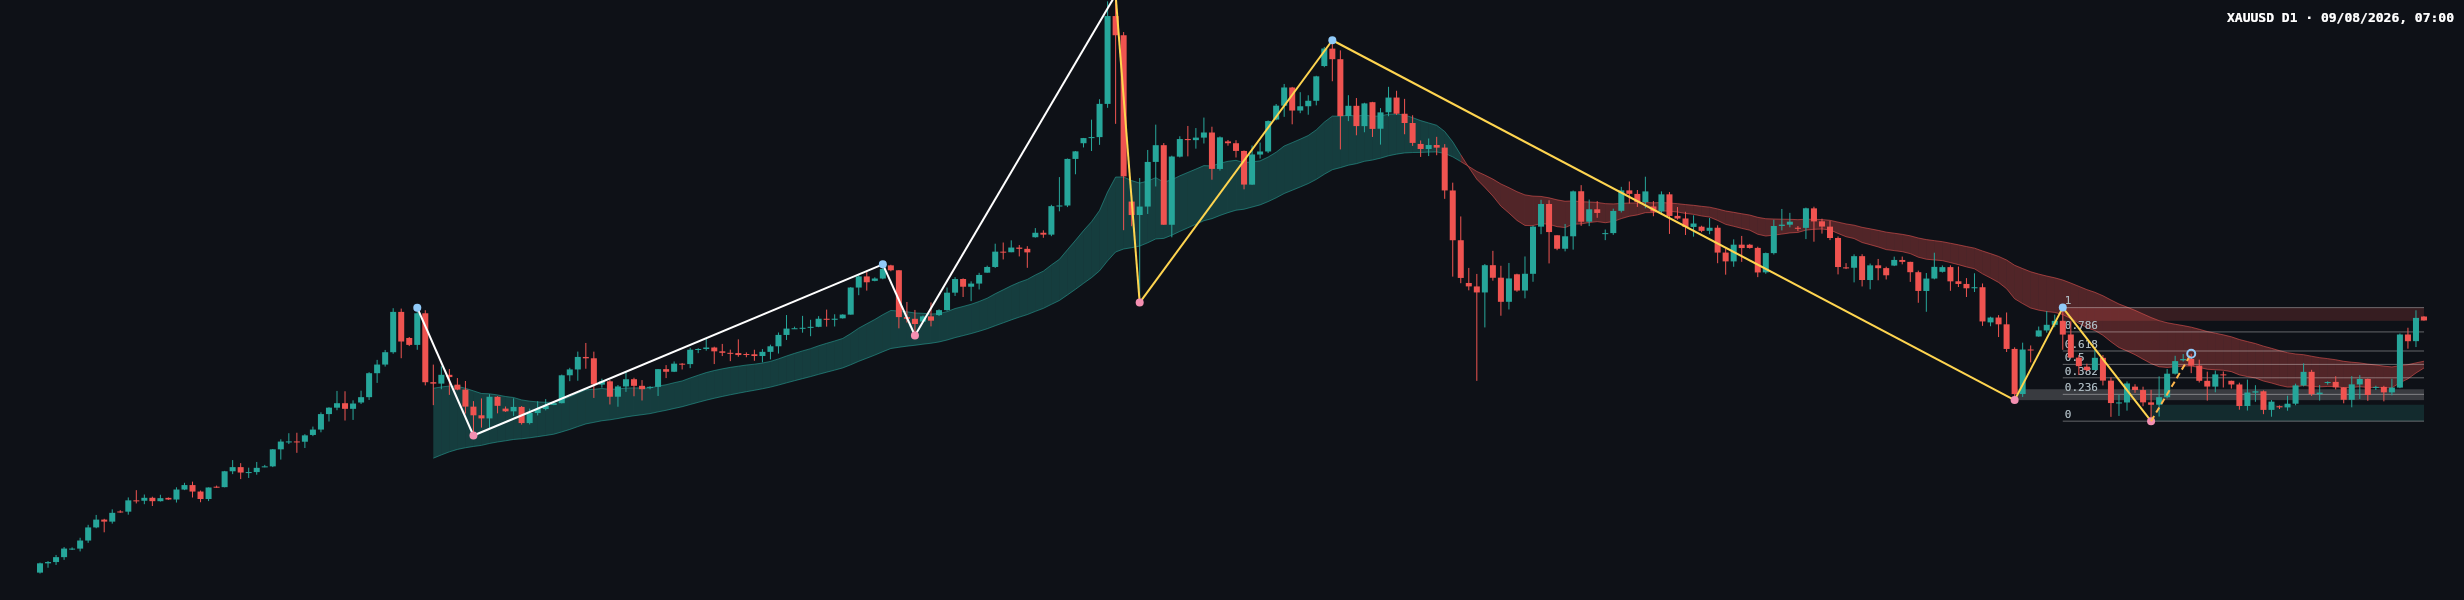
swing daily được xác nhận gần nhất là một đáy tại 3942.138. Dow leg daily hoàn tất gần nhất chạy từ 3942.138 đến 4382.441. Các mức Fibonacci của nó là 0 tại 3942.138, 0.236 tại 4046.050, 0.382 tại 4110.334, 0.5 tại 4162.290, 0.618 tại 4214.245, 0.786 tại 4288.216, và 1 tại 4382.441. Tỷ lệ retracement hiện tại là 0.887, đưa giá lên trên mức 0.786 và gần với phần trên của leg đã hoàn tất.
Vùng resistance daily tại 4331.294–4382.441 chồng lấn lên phần trên của cấu trúc Fibonacci đó. Điều này khiến vùng trở nên quan trọng trong việc phân biệt một nỗ lực tiếp diễn với một sự từ chối. Vùng resistance broken-retest tại 4023.812–4065.854 vẫn là vùng tham chiếu thấp hơn, trong khi 3942.138–4005.629 là vùng support daily chính được liệt kê trong báo cáo.
Báo cáo được cung cấp không có các giá trị EMA, volume hoặc chỉ báo momentum dạng số. Do đó, độ dốc EMA, khoảng cách, crossover và xác nhận volume chính xác không thể được xác định từ dữ liệu. Về mặt trực quan, các nến gần nhất đang tăng lên hướng tới vùng resistance daily, nhưng việc phân loại từng nến nên vẫn có điều kiện vì báo cáo không xác định các mô hình nến riêng lẻ.
Đọc nến đóng cửa gần nhất
Giá đóng cửa gần nhất tại 4332.699 nằm bên trong vùng resistance daily tại 4331.294–4382.441, thay vì rõ ràng vượt qua biên trên của vùng. Điều này cho thấy phe mua đã tiến tới một vùng quan trọng về mặt kỹ thuật, nhưng bản thân điều đó chưa xác nhận acceptance phía trên resistance.
Loại nến chính xác, tỷ lệ wick và vị trí đóng cửa trong biên độ nến không thể được xác định từ báo cáo xác định. Vì vậy, cách diễn giải thực tế mang tính điều kiện: một giá đóng cửa tiếp theo trên 4382.441 sẽ cho thấy phe mua đang vượt qua biên daily trên, trong khi sự từ chối bên trong 4331.294–4382.441 sẽ duy trì khung xu hướng giảm daily vững chắc. Việc quay trở lại dưới 4331.294 sẽ làm suy yếu đợt phục hồi daily hiện tại.
Các mức quan trọng
- 4331.294–4382.441: resistance daily và biên trên của leg Fibonacci hoàn tất gần nhất.
- 4288.216: mức Fibonacci daily 0.786 bên dưới giá đóng cửa hiện tại.
- 4023.812–4065.854: vùng resistance broken-retest.
- 3942.138–4005.629: vùng support daily và vị trí của swing low được xác nhận gần nhất tại 3942.138.
- 3331.873–3500.057: vùng support weekly broken-retest.
- 3268.058–3395.159: vùng support weekly rộng hơn.
- 5323.869–5450.970: vùng resistance weekly chính, với swing high weekly được xác nhận gần nhất tại 5450.970.
Các kịch bản có điều kiện
Kịch bản chính: từ chối tại resistance daily
Đây là cách diễn giải có xác suất cao hơn khi xu hướng daily vẫn giảm và giá chưa đóng cửa trên 4382.441. Nếu giá bị từ chối tại vùng 4331.294–4382.441 rồi di chuyển xuống dưới 4331.294, đợt phục hồi điều chỉnh sẽ mất động lượng. Vùng tiếp theo cần quan sát sẽ là 3942.138–4005.629. Kịch bản này bị vô hiệu khi có acceptance duy trì phía trên 4382.441.
Kịch bản phụ: tiếp diễn bullish
Nếu giá đóng cửa trên 4382.441 và giữ được vùng đó trong một lần retest tiếp theo, đợt phục hồi daily sẽ có bằng chứng mạnh hơn về sự tiếp diễn. Vùng mục tiêu của khung thời gian cao hơn khi đó sẽ là vùng resistance weekly tại 5323.869–5450.970. Kịch bản này bị vô hiệu nếu giá quay trở lại dưới 4331.294 sau nỗ lực breakout.
Kịch bản rủi ro: tích lũy trong biên độ
Giá có thể vẫn bị mắc kẹt giữa vùng resistance daily tại 4331.294–4382.441 và vùng tham chiếu Fibonacci thấp hơn tại 4288.216 mà không tạo ra sự kiện cấu trúc quyết định. Trong trường hợp đó, thị trường sẽ tiếp tục phản ánh sự xung đột giữa xu hướng tăng weekly và xu hướng giảm daily. Kịch bản này bị vô hiệu bởi một chuyển động rõ ràng vượt qua 4382.441 hoặc 4288.216; báo cáo không cung cấp các ước tính xác suất thống kê, vì vậy không có tỷ lệ phần trăm nào được gán.
Điều cần theo dõi
- Theo dõi xem giá daily được chấp nhận phía trên 4382.441 hay bị từ chối tại 4331.294–4382.441.
- Theo dõi 4288.216 như vùng tham chiếu Fibonacci gần nhất bên dưới vùng resistance.
- Quan sát xem một chuyển động giảm có chạm tới 3942.138–4005.629 hay tìm thấy support phía trên vùng đó.
- Xác nhận cho kịch bản bullish yêu cầu giá đóng cửa trên 4382.441 và một lần retest thành công. Xác nhận cho kịch bản bearish yêu cầu sự từ chối tại resistance, sau đó di chuyển xuống dưới 4331.294.
- False breakout và liquidity sweep đặc biệt đáng chú ý quanh 4331.294–4382.441.
- Báo cáo không có lịch tin tức hoặc lịch kinh tế, vì vậy thời điểm sự kiện không thể được xác định. Trader nên tự theo dõi DXY, lợi suất US, dữ liệu lạm phát, dữ liệu việc làm, thông điệp của ngân hàng trung ương và các tiêu đề địa chính trị.
Tóm tắt
- Xu hướng weekly tăng và vững chắc, với resistance weekly tại 5323.869–5450.970.
- Xu hướng daily giảm và vững chắc, dù sub-trend đang tăng.
- Giá đóng cửa gần nhất tại 4332.699 nằm bên trong resistance daily tại 4331.294–4382.441.
- Tỷ lệ retracement Fibonacci hiện tại là 0.887, cao hơn mức 0.786 tại 4288.216.
- Điểm quan trọng nhất là liệu giá có thể thiết lập acceptance phía trên 4382.441 hay bị từ chối và di chuyển xuống dưới 4331.294.
XAU/USD đang ở ngã rẽ kỹ thuật: cấu trúc weekly vẫn ủng hộ cách diễn giải bullish rộng hơn, trong khi cấu trúc daily yêu cầu bằng chứng trước khi cách diễn giải đó có thể giành lại quyền kiểm soát. Cho đến khi giá giải quyết vùng resistance daily, cả hai kịch bản tiếp diễn và từ chối vẫn là những kịch bản phân tích hợp lệ.
Bài viết này chỉ là phân tích kỹ thuật và thông tin tham khảo, không phải lời khuyên đầu tư. Thị trường luôn có rủi ro và độc giả chịu trách nhiệm về quyết định của mình.
#XAUUSD #Gold #TechnicalAnalysis #Forex #PriceAction
Mô tả meta: XAU/USD kiểm tra resistance daily tại 4331.294–4382.441 khi xu hướng weekly và daily phân kỳ. Khám phá các kịch bản bullish và bearish.