
XAU/USD closed at 4342.514, with the market showing a clear conflict between timeframes. The weekly trend remains firmly up, while the daily trend remains firmly down and its sub-trend is up. Price is currently pressing into the daily resistance zone at 4331.294–4382.441, so the next directional signal depends on whether buyers can secure acceptance above that area or sellers can force a rejection.
| Metric | Value |
|---|---|
| Most recent close | 4342.514 |
| Prior session move | Not determinable from the report |
| Weekly trend | Up, firm |
| Daily trend | Down, firm; sub-trend up |
| Moving-average values | Not determinable from the report |
| Nearest resistance | 4331.294–4382.441 |
| Nearest support | 3942.138–4005.629 |
| Active Fibonacci reading | Current retracement ratio 0.909; latest completed leg levels include 4288.216 and 4382.441 |
| Current bias | Range-bound at resistance, with bearish daily pressure |
Higher-timeframe context: Weekly structure
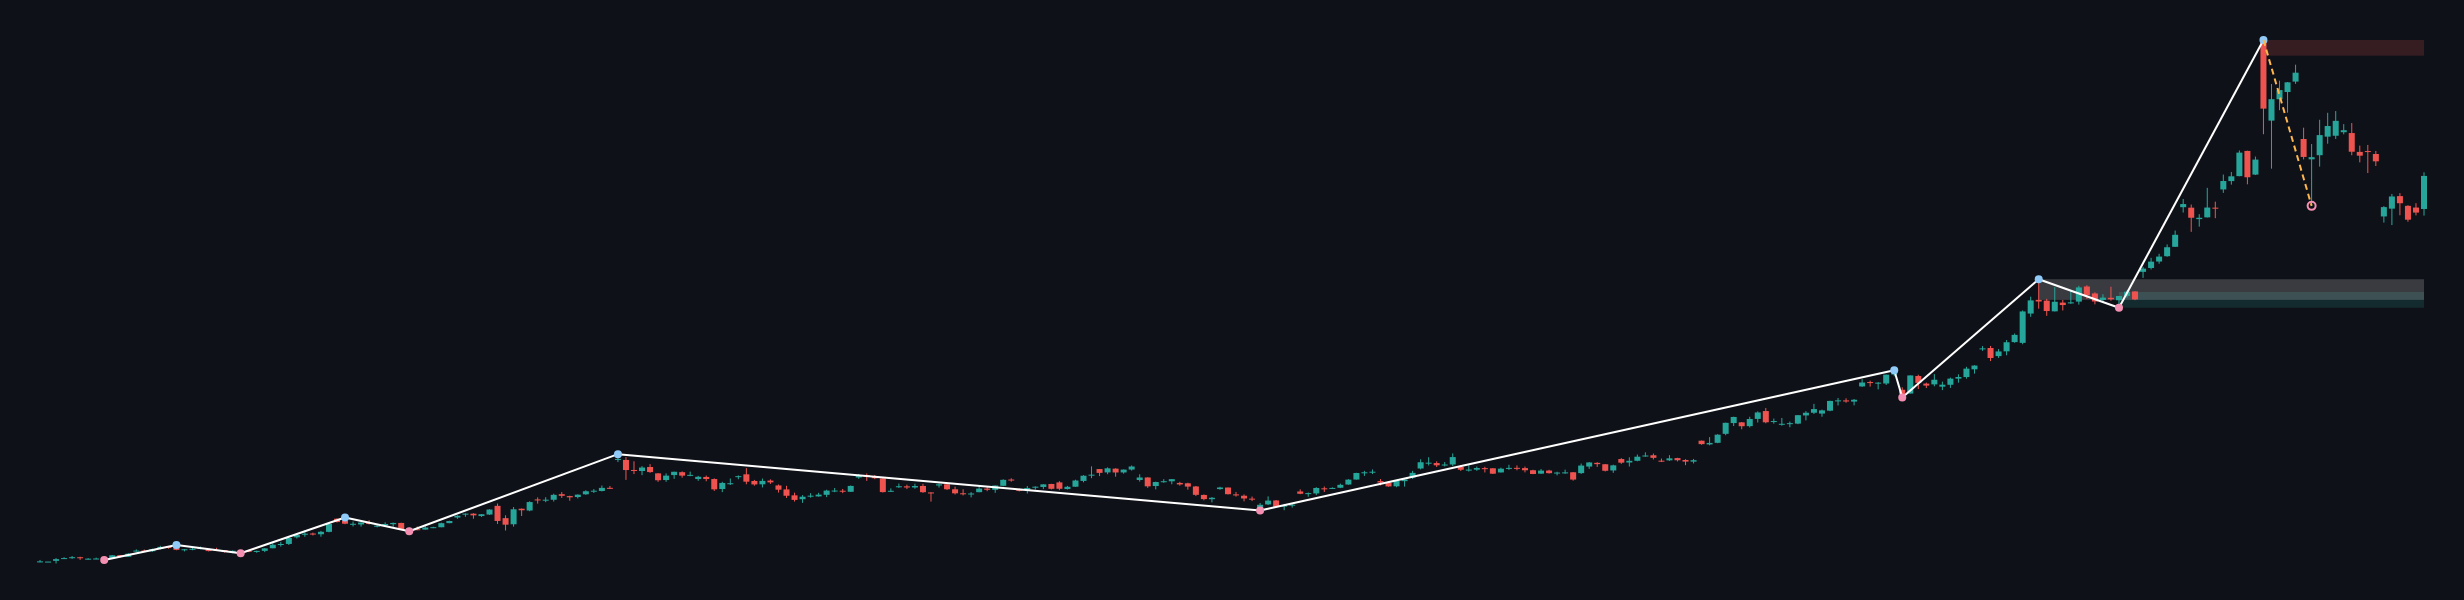
The weekly chart retains a firm uptrend, while its sub-trend is down. The most recent confirmed weekly swing is a high at 5450.970, and the report identifies no weekly structure event. This means the broader bullish structure has not been formally invalidated, but the decline from the confirmed swing high continues to define the current correction.
Weekly support is identified at 3268.058–3395.595. A second area at 3331.873–3500.057 is marked as a broken-retest zone. Weekly resistance is located at 5323.433–5450.970. The report does not provide weekly moving-average values or their slope, so price position relative to those averages is not determinable.
The weekly view therefore permits a continuation of the broader advance if demand returns above the lower-timeframe structure, but it also allows further corrective movement while price remains below the weekly swing high and above the larger support areas. The weekly ATR is 255.074, indicating that the higher-timeframe context allows materially wider movement than the daily ATR.
Main-frame structure: Daily analysis
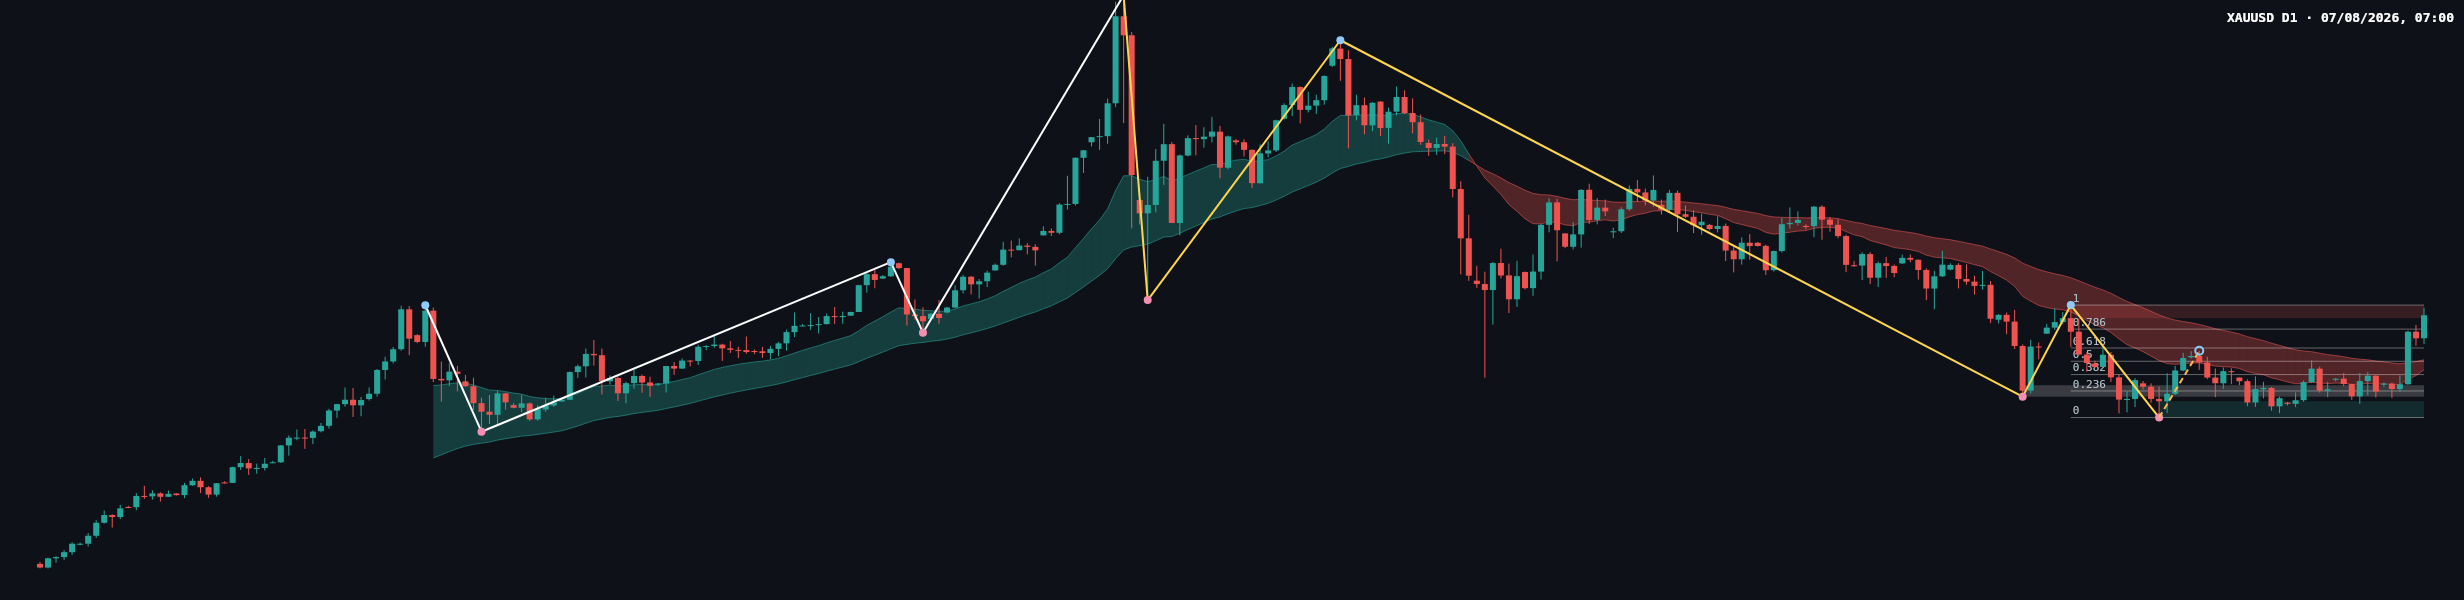
The daily main trend is down, firm, while the sub-trend is up. This is a misalignment with the weekly chart and can be read as a counter-trend recovery within a broader daily decline, unless price establishes acceptance above the daily resistance zone at 4331.294–4382.441. The report identifies no daily structure event. The most recent confirmed daily swing is a low at 3942.138.
The main daily support zone is 3942.138–4005.629. The broken-retest resistance area is 4023.812–4068.424, which is now below the latest close and may be relevant if the recovery loses momentum. The daily ATR is 89.225.
The latest completed Dow leg has Fibonacci levels from 3942.138 at 0 to 4382.441 at 1. Intermediate references are 4046.050 at 0.236, 4110.334 at 0.382, 4162.290 at 0.5, 4214.245 at 0.618, and 4288.216 at 0.786. With the current retracement ratio at 0.909, price is close to the upper boundary of this completed leg and is testing the area represented by 4382.441.
The chart shows a sequence of declining price action followed by a rebound into the overhead moving-average ribbon and resistance. However, exact candle bodies, wick proportions, range comparisons, volume, and momentum readings are not provided in the deterministic report. Those details are therefore not determinable with the required precision.
Key levels and the latest closing candle
The close at 4342.514 sits within the daily resistance zone at 4331.294–4382.441. It is also above the Fibonacci reference at 4288.216 and below the upper leg boundary at 4382.441. The report does not classify the latest candle or specify its close location within the candle range, so it cannot be reliably labelled as a pin bar, engulfing candle, doji, or continuation candle.
From a price-action perspective, the location is more important than an unsupported candle label: buyers have recovered into resistance, but sellers still have a clearly defined area in which to defend the daily downtrend. A daily close above 4382.441 would improve the case that the recovery is becoming a broader reversal attempt. Rejection from 4331.294–4382.441, followed by a move back toward 4023.812–4068.424, would preserve the bearish daily interpretation.
Conditional scenarios
- Primary scenario — resistance rejection: If price fails to hold above 4331.294–4382.441 and subsequently weakens toward the broken-retest area at 4023.812–4068.424, the daily downtrend would remain the dominant decision-making framework. A move back above 4382.441 would invalidate this bearish interpretation. Estimated probability: not determinable from the report.
- Secondary scenario — bullish acceptance: If price closes above 4382.441 and maintains acceptance above the daily resistance zone, the recovery could extend toward the weekly resistance zone at 5323.433–5450.970. A return below 4331.294 would invalidate the acceptance signal. Estimated probability: not determinable from the report.
- Risk or surprise scenario — deeper correction: If selling pressure carries price below 3942.138–4005.629, attention would shift toward the weekly support zones at 3331.873–3500.057 and 3268.058–3395.595. Recovery above 4005.629 would weaken this deeper-correction scenario. Estimated probability: not determinable from the report.
The directional bias is cautious and resistance-sensitive: the weekly backdrop is constructive, but the daily trend favours sellers until price proves otherwise above 4382.441. The expected range cannot be quantified beyond the reported daily ATR of 89.225 and weekly ATR of 255.074.
Key considerations
- Levels to watch: resistance at 4331.294–4382.441; support at 3942.138–4005.629; broken-retest resistance at 4023.812–4068.424; weekly support at 3331.873–3500.057 and 3268.058–3395.595; weekly resistance at 5323.433–5450.970.
- Observation zones: the daily resistance band is the immediate area for judging acceptance or rejection. The broken-retest area and the daily support zone are the principal lower zones for evaluating whether sellers retain control.
- Confirmation: the bullish case requires sustained acceptance above 4382.441. The bearish case is strengthened by rejection from 4331.294–4382.441 and renewed movement toward 4023.812–4068.424.
- Common traps: a brief break of either edge of the resistance zone may reverse before confirmation. Liquidity sweeps and volatility around major trading-session transitions can also create false signals.
- Fundamental monitoring: traders should monitor the US dollar, Treasury yields, the economic calendar, inflation data, employment data, central-bank communication, and geopolitical headlines. No exact event time is supplied in the report.
- Risk discipline: technical scenarios should be treated as conditional rather than predictive. Readers should consider exposure carefully, avoid entering immediately ahead of major news, and use a plan that defines risk before market volatility increases.
Summary
- The weekly trend is up and firm, but the weekly sub-trend is down from the confirmed high at 5450.970.
- The daily trend is down and firm, with an up sub-trend recovering into 4331.294–4382.441.
- The latest close at 4342.514 is above 4288.216 but remains below 4382.441.
- A confirmed move above 4382.441 would open a bullish scenario toward 5323.433–5450.970.
- Rejection and weakness below the current resistance area would keep 4023.812–4068.424 and 3942.138–4005.629 in focus.
The single most important thing today is whether price achieves acceptance above or rejection from 4331.294–4382.441.
#XAUUSD #GoldAnalysis #PriceAction #TechnicalAnalysis #Forex
Meta description: XAU/USD analysis: gold closes at 4342.514 inside daily resistance, with weekly bullish context and daily bearish pressure.
This article is technical analysis and reference information only, not investment advice. Markets carry risk, and readers are responsible for their own decisions.