
XAU/USD is presenting a mixed technical picture. The weekly framework remains firmly upward, although its sub-trend is down, while the daily framework remains firmly downward, with an upward sub-trend. The latest daily close at 4074.814 places price above the daily broken-retest resistance zone at 4023.812–4062.752 and above the latest Fibonacci level at 4046.050. The market is therefore trading in an area where a continuation of the daily recovery and a renewed bearish response are both technically possible.
Higher-timeframe context: Weekly structure
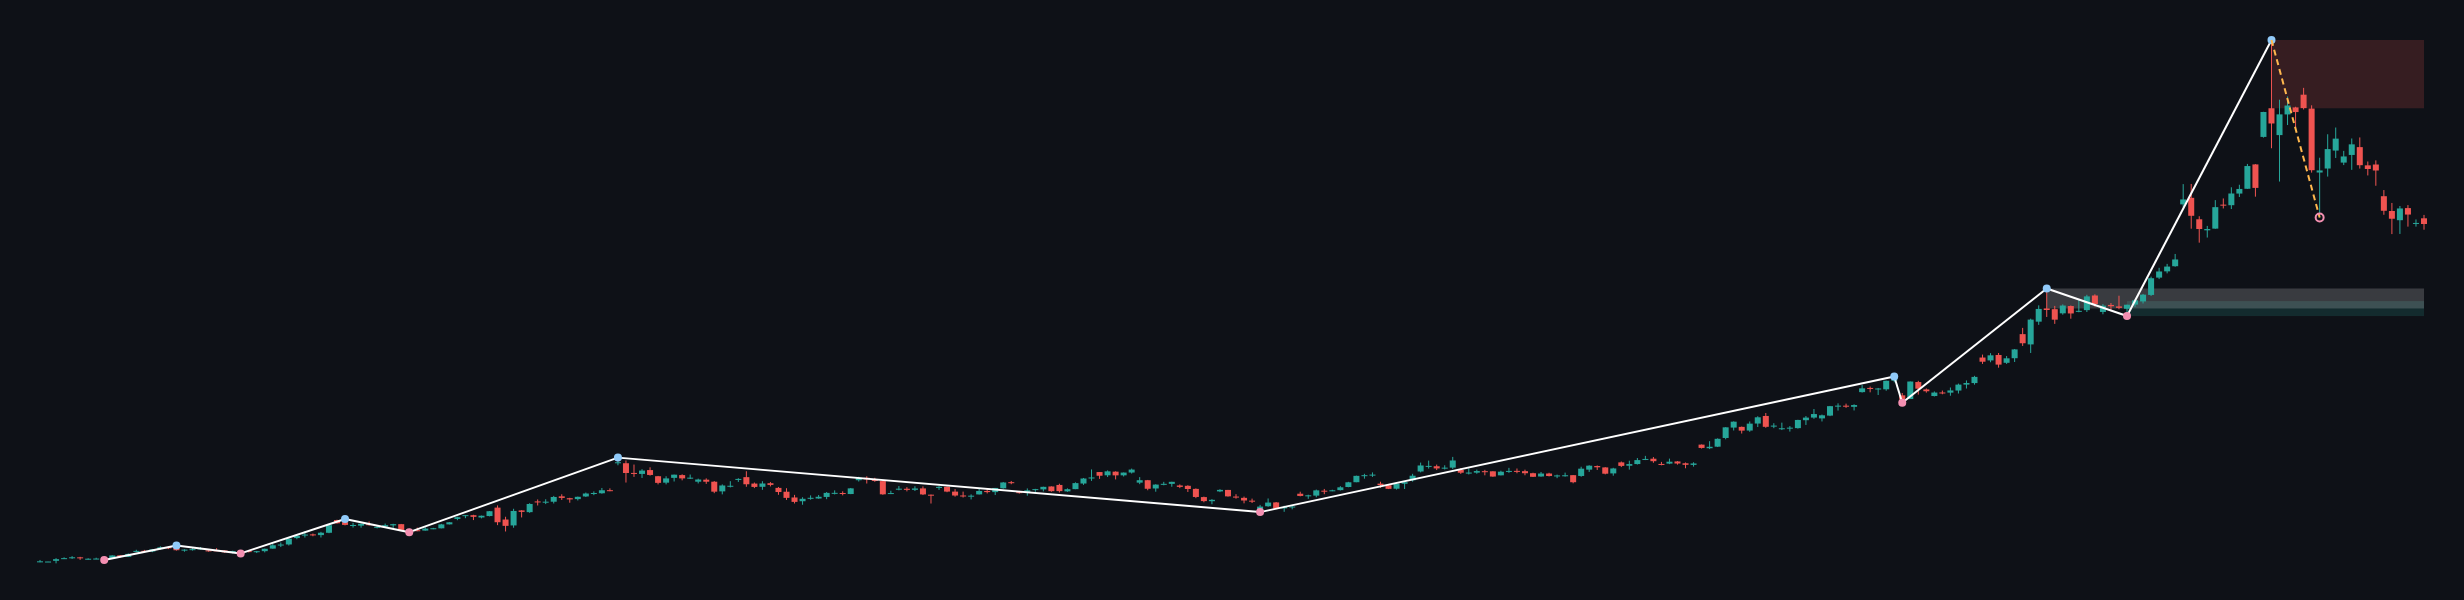
The weekly main trend is up and described as firm, while the sub-trend is down. No weekly structure event is reported. The most recent confirmed weekly swing is the high at 5595.362, so the broader advance remains the dominant structural reference even though the latest leg has moved lower.
The weekly last closed price is 4043.851. Price is positioned above the weekly support zone at 3268.058–3393.690 and above the broken-retest support zone at 3331.873–3500.057. The weekly resistance zone at 5019.871–5595.362 remains overhead. The weekly ATR is 251.264, indicating a materially wider higher-timeframe range than the daily ATR of 77.880.
Weekly EMA20 and EMA50 values are not included in the deterministic report, so their exact position, slope, spacing, and crossover status are not determinable here. Weekly Fibonacci levels are also not supplied. The available evidence therefore favors treating the weekly chart as an established upward framework undergoing a corrective phase, rather than assuming that the correction has already reversed the larger trend.
Main-frame structure: Daily analysis
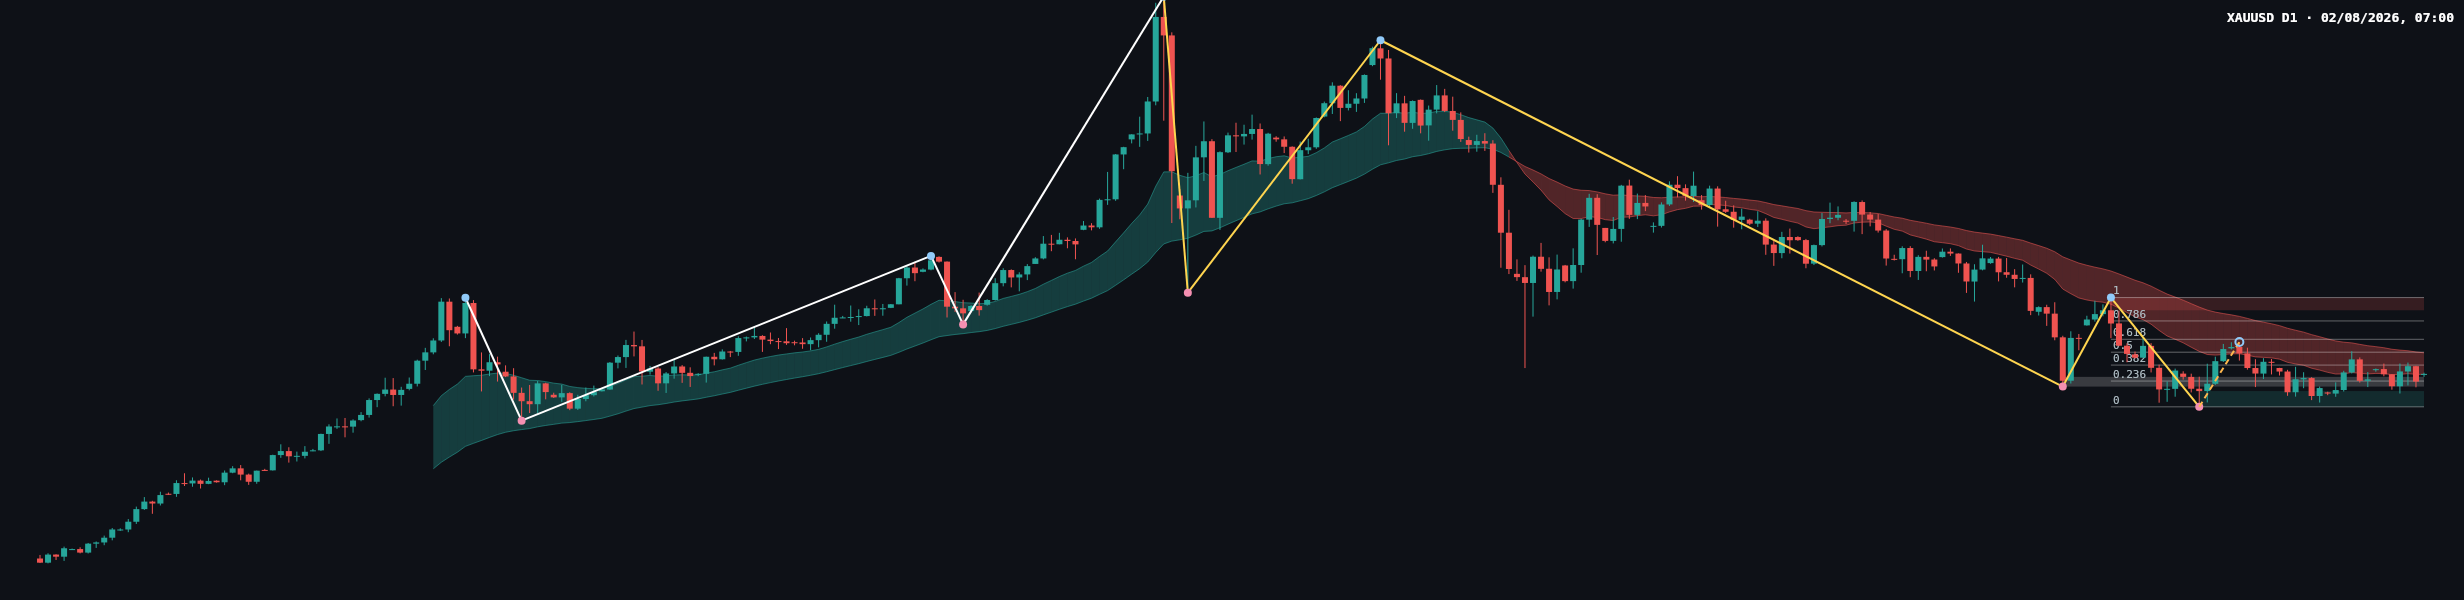
The daily main trend is down and firm, while the sub-trend is up. This does not align with the weekly main trend. The upward daily sub-trend can therefore be read as a counter-trend recovery within a broader daily decline, although sustained acceptance above the nearby resistance and Fibonacci levels would make the recovery more significant.
The most recent confirmed daily swing is the low at 3942.138. No daily structure event is reported, so there is no confirmed BOS or CHoCH in the deterministic data. The daily support zone is 3942.138–4005.629. Above price, the daily resistance zone is 4331.294–4382.441, while the broken-retest zone is 4023.812–4062.752.
Price is currently above the daily broken-retest zone and above the Fibonacci 0.236 level at 4046.050. The next Fibonacci reference is 0.382 at 4110.334, followed by 0.5 at 4162.290, 0.618 at 4214.245, and 0.786 at 4288.216. The latest completed Dow leg runs from 3942.138 to 4382.441, and the current retracement ratio is 0.301.
Exact daily EMA20 and EMA50 readings are not included in the report. Their precise slope, separation, and crossover status are therefore not determinable. The chart nevertheless shows price consolidating beneath a descending red moving-average area, while the latest rebound has lifted price back toward the lower Fibonacci references. This leaves the daily recovery in a test phase rather than confirming a completed reversal.
Key levels and the latest candles
The key near-term reference is the band at 4023.812–4062.752. Holding above this broken-retest area would preserve the recovery structure from 3942.138. A return below it would weaken the recovery and bring the broader daily support zone at 3942.138–4005.629 back into focus.
The latest candles on the chart show alternating advances and declines around the lower resistance area, followed by sideways price action. Exact candle classifications such as a Doji, Pin bar, Engulfing candle, or Marubozu are not determinable from the deterministic report. The closing price at 4074.814 is above 4062.752 and 4046.050, but remains below 4110.334. This positioning suggests that buyers have defended the recovery above the broken-retest zone, while sellers still have a clear technical reference at the next Fibonacci level and the higher resistance zone.
Volume and a separate momentum reading are not supplied in the report. They cannot be used as confirmation. The current price location instead requires a response around 4110.334 on the upside and 4062.752 or 4046.050 on the downside.
Conditional scenarios
Primary scenario: recovery tests higher Fibonacci resistance
If daily price sustains trade above 4110.334, the recovery from 3942.138 could extend toward the Fibonacci area at 4162.290–4214.245. A stronger continuation could bring the wider resistance region at 4288.216–4382.441 into view. The scenario would be invalidated by a return below the broken-retest zone at 4023.812–4062.752. No probability estimate is assigned because the deterministic report does not provide scenario probabilities.
Secondary scenario: consolidation around the broken-retest zone
If price remains above 4023.812–4062.752 but cannot establish a daily close above 4110.334, the market may continue ranging between the broken-retest area and the next Fibonacci resistance. This would preserve the daily sub-trend up without resolving the conflict with the firm daily main trend down. A decisive break below 4023.812 would invalidate the constructive consolidation interpretation.
Risk scenario: bearish rejection and return to support
If price is rejected below 4110.334 and then loses 4046.050, sellers could pressure the broken-retest zone at 4023.812–4062.752. A break below that zone would expose the daily support area at 3942.138–4005.629, with 3942.138 serving as the most recent confirmed swing low. The bearish continuation view would be weakened by sustained trade back above 4110.334.
The daily bias is cautiously recovery-oriented above 4023.812–4062.752, but the firm daily main trend down means that upside progress requires confirmation above 4110.334.
Key considerations for the session
- Resistance: 4110.334, 4162.290, 4214.245, and the broader zone at 4331.294–4382.441.
- Support: 4046.050, the broken-retest zone at 4023.812–4062.752, and the main daily support zone at 3942.138–4005.629.
- Higher-timeframe references: weekly support at 3268.058–3393.690 and broken-retest support at 3331.873–3500.057; weekly resistance at 5019.871–5595.362.
- Confirmation: a sustained daily close above 4110.334 would strengthen the recovery case, while a close below 4023.812 would favor renewed downside pressure.
- Traps: false breaks around 4062.752 and 4110.334, followed by reversals into the broken-retest zone, are the principal technical risks.
The report contains no news or economic-calendar schedule, so specific event timing is not determinable. Traders should nevertheless account for the usual sensitivity of gold to the US dollar, US yields, major inflation and employment releases, central-bank communication, and geopolitical headlines. General risk principles remain important: keep exposure appropriate to the account, define risk before acting, and avoid committing to a directional view immediately ahead of major news.
Summary
- The weekly main trend is firmly up, with the latest confirmed swing high at 5595.362 and no reported structure event.
- The daily main trend is firmly down, but the sub-trend is up from the confirmed low at 3942.138.
- The close at 4074.814 is above 4062.752 and 4046.050, keeping the recovery active.
- 4110.334 is the next important upside Fibonacci test; 4023.812–4062.752 is the key downside decision zone.
The single most important thing today is whether price can maintain acceptance above 4062.752 and challenge 4110.334, or instead fall back into the broken-retest zone.
#XAUUSD #GoldAnalysis #PriceAction #Fibonacci #TechnicalAnalysis
Meta description: XAU/USD daily analysis: gold holds above 4023.812–4062.752 while 4110.334 and 4331.294–4382.441 define the upside test.
This article is technical analysis and reference information only, not investment advice. Markets carry risk, and readers are responsible for their own decisions.