
XAU/USD est pris entre des unités de temps contradictoires. Le graphique hebdomadaire conserve une tendance haussière ferme, mais le graphique journalier reste fermement baissier avec une sous-tendance haussière. La dernière clôture journalière à 4084.790 se situe au-dessus de la zone de cassure-retest à 4023.812–4063.728, tandis que la zone de résistance journalière plus large à 4331.294–4382.441 reste au-dessus. La question clé est de savoir si cette reprise se transforme en un retournement durable ou si elle reste un rebond contre la tendance.
Contexte de l'unité de temps supérieure : Hebdomadaire
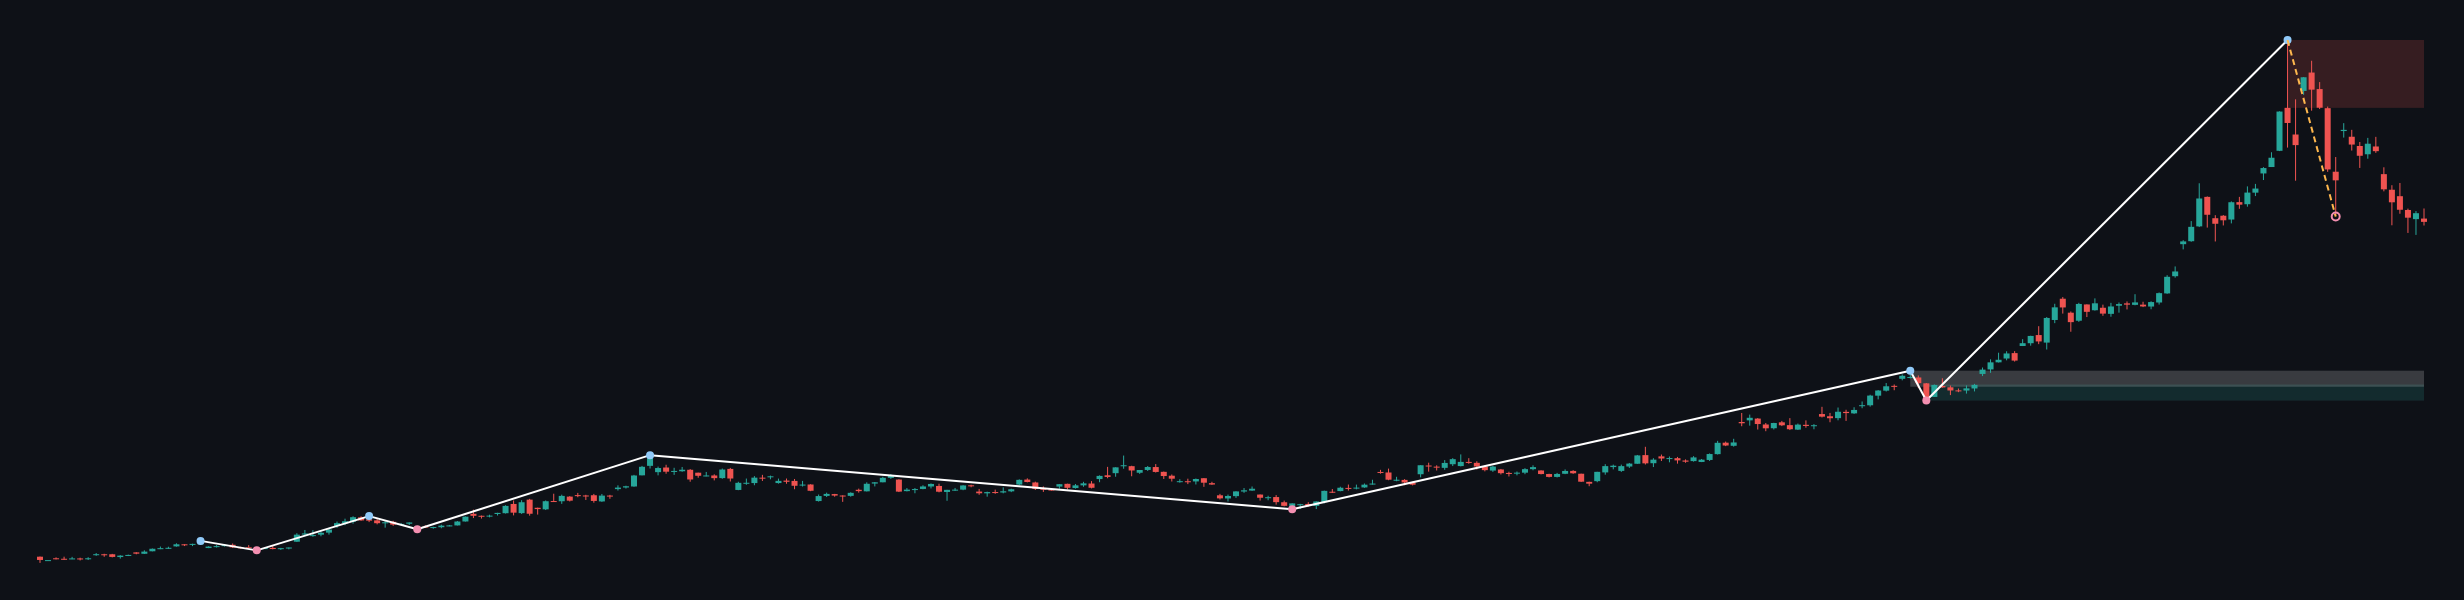
La tendance principale hebdomadaire est haussière, et le swing confirmé le plus récent est un sommet à 5595.362. La sous-tendance est baissière, de sorte que la progression plus large traverse actuellement une phase corrective. Aucun événement de structure hebdomadaire n'est enregistré, ce qui signifie qu'il n'y a pas de cassure confirmée renversant le cadre haussier plus large.
Le support hebdomadaire est identifié à 2536.779–2672.583. Une deuxième zone à 2654.295–2790.099 est marquée comme support de cassure-retest. La résistance hebdomadaire est située à 5019.871–5595.362. Avec le dernier prix hebdomadaire clôturé à 4052.808, le prix se positionne sous cette résistance et au-dessus des zones de support à long terme répertoriées.
L'ATR hebdomadaire est de 271.609, indiquant une enveloppe de mouvement d'unité de temps supérieure matériellement plus large que l'ATR journalier. Un niveau de Fibonacci hebdomadaire n'est pas fourni dans le rapport déterministe, l'interaction avec un ratio de Fibonacci hebdomadaire spécifique n'est donc pas déterminable à partir des données disponibles.
L'unité de temps supérieure permet donc une hausse supplémentaire si la reprise journalière obtient confirmation, mais elle ne supprime pas la structure baissière journalière. Tant que la tendance journalière ne change pas, la vision haussière hebdomadaire est mieux traitée comme un contexte directionnel plus large plutôt que comme un retournement à court terme confirmé.
Structure du cadre principal : Journalier
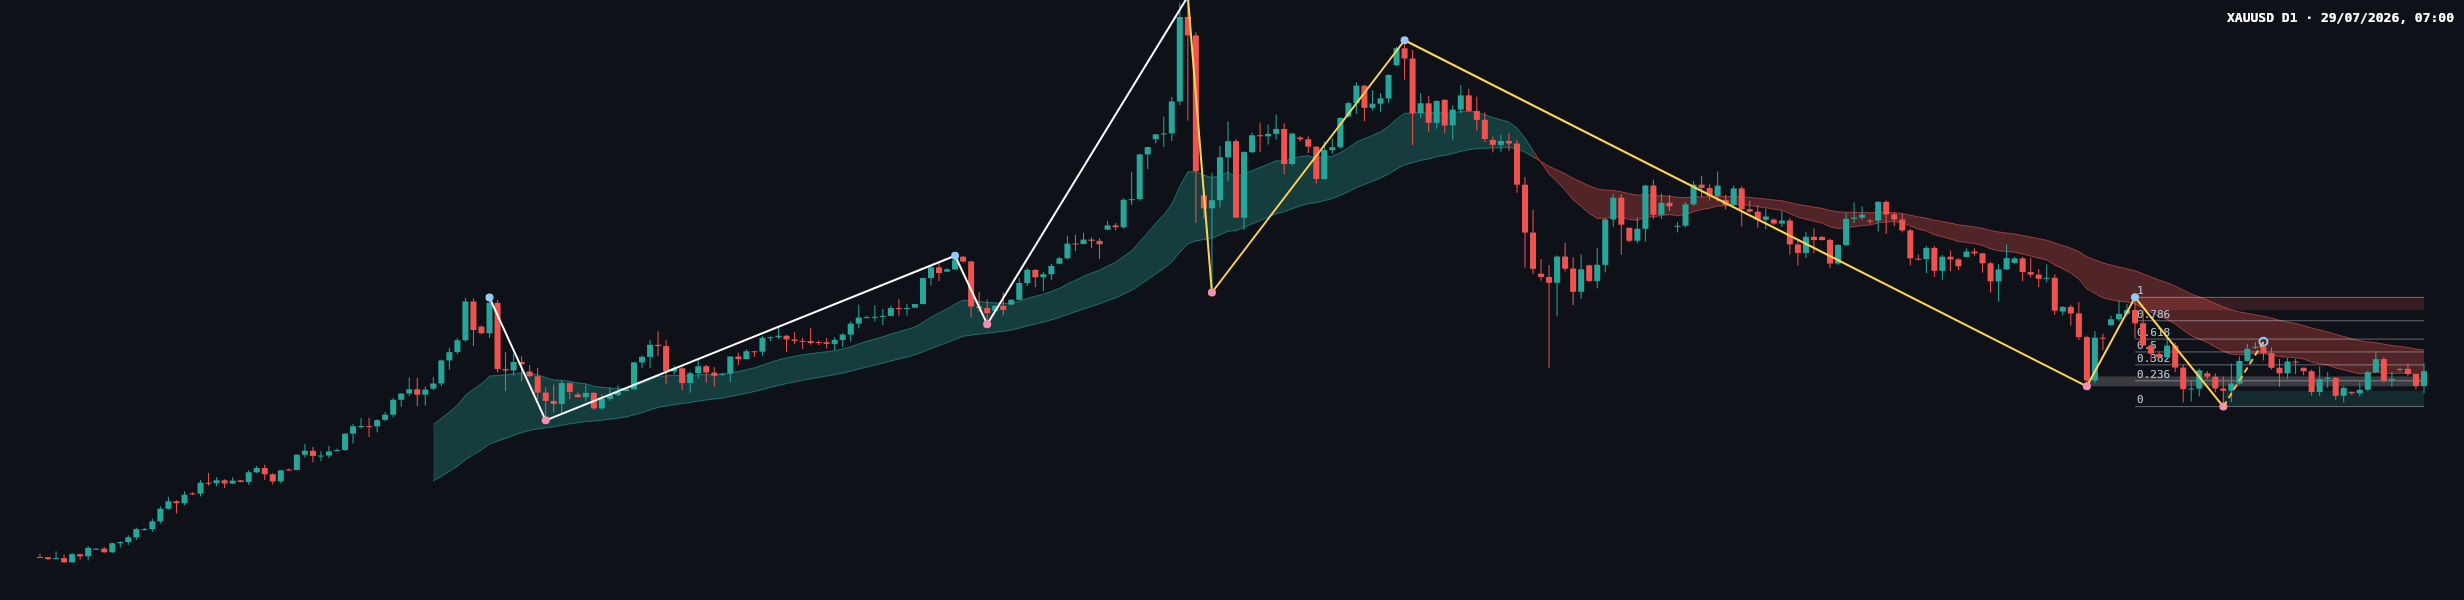
La tendance principale journalière est baissière, tandis que la sous-tendance est haussière. Ce désalignement est cohérent avec une reprise à l'intérieur d'une baisse plus importante, bien qu'une progression plus forte puisse devenir un signal de retournement précoce si elle franchit la structure de résistance pertinente. Aucun événement de structure journalier n'est enregistré, et le swing confirmé le plus récent est un creux à 3942.138.
La zone de résistance journalière à 4331.294–4382.441 est la principale barrière à la hausse. Le support journalier est à 3942.138–4005.629. La zone à 4023.812–4063.728 est marquée comme résistance de cassure-retest, bien que la dernière clôture ait rebondi au-dessus. Cela rend la zone importante pour évaluer si le rebond est accepté ou rejeté.
L'ATR journalier est de 79.832. Les valeurs des EMA ne sont pas incluses dans le rapport déterministe, leurs niveaux exacts, leur espacement, leur pente et leur statut de croisement ne sont donc pas déterminables à partir du rapport. Le graphique montre visuellement une enveloppe de moyenne mobile, mais des affirmations numériques exactes sur ces moyennes ne seraient pas fiables selon les données disponibles.
Niveaux clés et carte de Fibonacci
| Zone | Niveau ou zone | Rôle |
|---|---|---|
| Clôture journalière actuelle | 4084.790 | Point de référence pour le rebond actuel |
| Près de la zone de cassure-retest | 4023.812–4063.728 | Zone à évaluer pour acceptation ou rejet |
| Support journalier | 3942.138–4005.629 | Test de continuation baissière et zone de demande |
| Résistance journalière | 4331.294–4382.441 | Barrière majeure pour un retournement plus large |
| Support hebdomadaire | 2536.779–2672.583 | Zone de support à plus long terme |
| Résistance hebdomadaire | 5019.871–5595.362 | Zone d'offre de l'unité de temps supérieure |
La dernière jambe de Dow journalière complétée a des niveaux de Fibonacci à 3942.138 pour zéro, 4046.050 pour 0.236, 4110.334 pour 0.382, 4162.290 pour 0.5, 4214.245 pour 0.618, 4288.216 pour 0.786 et 4382.441 pour un. Le ratio de retracement actuel est de 0.324, plaçant le rebond entre les niveaux 0.236 et 0.382. Cela laisse 4110.334 comme prochaine référence de Fibonacci répertoriée au-dessus de la dernière clôture, tandis que 4046.050 est la référence de retracement plus proche en dessous.
Action des prix journalière récente
Le graphique montre une baisse depuis la zone de swing journalière plus large, suivie d'un creux prononcé près du swing confirmé à 3942.138. Le prix a ensuite rebondi dans la région de cassure-retest et a depuis consolidé sous la structure de résistance descendante. Les dernières bougies apparaissent comparativement comprimées par rapport au mouvement directionnel précédent, suggérant un équilibre entre les acheteurs essayant d'étendre le rebond et les vendeurs défendant l'offre au-dessus.
Les classifications exactes des bougies, les proportions des mèches et les plages bougie par bougie ne sont pas répertoriées dans le rapport déterministe. Elles doivent donc être traitées avec prudence plutôt que d'être étiquetées comme une formation spécifique. La structure disponible soutient une interprétation mesurée : les acheteurs ont regagné du terrain au-dessus de la zone de cassure-retest, mais les vendeurs conservent l'avantage tant que la tendance principale journalière reste baissière et que le prix reste sous 4331.294–4382.441.
Les lectures de volume et de momentum ne sont pas fournies dans le rapport. La confirmation ou la divergence par rapport à ces outils n'est donc pas déterminable à partir des données disponibles.
Scénarios conditionnels
Scénario principal : le rebond rencontre une résistance
- Déclencheur : Le prix reste sous 4331.294–4382.441 et perd l'acceptation au-dessus de la zone de cassure-retest à 4023.812–4063.728.
- Zone cible : La première zone de baisse à surveiller est 3942.138–4005.629.
- Invalidation : Un mouvement soutenu à travers 4331.294–4382.441 affaiblirait cette interprétation de continuation baissière.
- Évaluation : C'est le scénario prioritaire tant que la tendance principale journalière reste fermement baissière et qu'aucun événement de structure n'a été enregistré.
Scénario secondaire : la reprise s'étend
- Déclencheur : Le prix se maintient au-dessus de 4023.812–4063.728 et progresse à travers les références de Fibonacci à 4110.334, 4162.290 et 4214.245.
- Zone cible : La prochaine zone majeure à observer est 4331.294–4382.441, qui contient le niveau de Fibonacci à 4382.441.
- Invalidation : Un retour sous 3942.138–4005.629 minerait la structure de reprise.
- Évaluation : Cela représenterait une tentative de retournement haussier en développement, mais une confirmation serait toujours nécessaire car la tendance principale journalière est baissière.
Scénario de risque : échec de la reprise et cassure du support
- Déclencheur : Le prix rejette la zone de rebond actuelle et casse sous 3942.138–4005.629.
- Zone cible : Le rapport identifie le support hebdomadaire plus large à 2536.779–2672.583 et la zone de cassure-retest à 2654.295–2790.099 comme des supports à plus long terme à surveiller.
- Invalidation : Un retour au-dessus de 4023.812–4063.728 réduirait la force immédiate de ce scénario baissier.
- Évaluation : Cela alignerait plus étroitement les pressions correctives journalières et hebdomadaires, bien que la distance entre les zones journalières et hebdomadaires signifie que le chemin peut rester volatil.
Aucun pourcentage de probabilité n'est attribué car le rapport déterministe ne fournit aucune donnée de probabilité. Le biais penche à la baisse sur l'unité de temps journalière, le marché restant probablement en range ou volatil jusqu'à ce que l'une des zones déclarées soit décisivement acceptée ou rejetée.
Considérations clés
- Niveaux à surveiller : 4331.294–4382.441 est la résistance principale ; 4023.812–4063.728 est la zone de cassure-retest proche ; et 3942.138–4005.629 est le support journalier principal.
- Zones à observer : Les informations les plus claires devraient provenir du comportement des prix au niveau de la zone de cassure-retest et des zones de support et de résistance journalières, plutôt que du mouvement au milieu du range.
- Confirmation : Une clôture journalière au-delà d'une zone suivie d'un retest réussi fournirait des preuves structurelles plus fortes qu'une brève excursion intrajournalière.
- Pièges courants : De fausses cassures et des chasses à la liquidité peuvent se produire autour des deux côtés de la consolidation. L'or peut également réagir brutalement lors de données majeures des États-Unis et de communications de banques centrales.
- Facteurs fondamentaux : Le DXY, les rendements des États-Unis, l'IPC, les NFP, la communication du FOMC, les discours de la Réserve fédérale et les gros titres géopolitiques sont des moteurs pertinents. Aucune heure d'événement exacte n'est fournie dans le rapport.
- Principes de risque : Les contrôles de risque généraux incluent le maintien d'une exposition proportionnelle au risque du compte, l'évitement des décisions juste avant des nouvelles majeures et la reconnaissance qu'un stop-loss peut toujours être affecté par des gaps ou un slippage. Ce sont des principes généraux, pas des instructions de trade.
- Comportement des sessions : Le trading asiatique peut établir un range initial, l'activité européenne peut tester ce range, et le mouvement des États-Unis apporte souvent la repricing la plus forte. Ces tendances sont contextuelles plutôt que garanties.
Résumé
- La tendance hebdomadaire est fermement haussière, mais la sous-tendance hebdomadaire est baissière et aucun événement de structure n'est enregistré.
- La tendance principale journalière est fermement baissière, avec une sous-tendance haussière indiquant une phase de reprise.
- La dernière clôture à 4084.790 est au-dessus de la zone de cassure-retest à 4023.812–4063.728.
- La résistance journalière à 4331.294–4382.441 est le test clé pour tout retournement haussier plus large.
- Une cassure sous 3942.138–4005.629 rétablirait la pression à la baisse et remettrait la structure de support au premier plan.
La chose la plus importante aujourd'hui est de savoir si le prix peut maintenir son acceptation au-dessus de 4023.812–4063.728 sans être rejeté vers 3942.138–4005.629.
#XAUUSD #GoldAnalysis #PriceAction #DowTheory #TechnicalAnalysis
Meta description : Analyse XAU/USD : la force hebdomadaire entre en conflit avec la faiblesse journalière alors que le prix teste le support de cassure-retest sous la résistance clé.
Cet article est une analyse technique et des informations de référence uniquement, pas un conseil en investissement. Les marchés comportent des risques et les lecteurs sont responsables de leurs propres décisions.