
GBPUSD closed at 1.33684 on the Daily frame, with the market pulling back from the 1.36441–1.36754 resistance zone toward support at 1.32730–1.32982. The daily main trend remains firmly up, but the sub-trend is down; on the Weekly chart, the main trend is firmly down while the sub-trend is up. This conflict makes the reaction around the current Fibonacci area especially important.
Higher-timeframe context
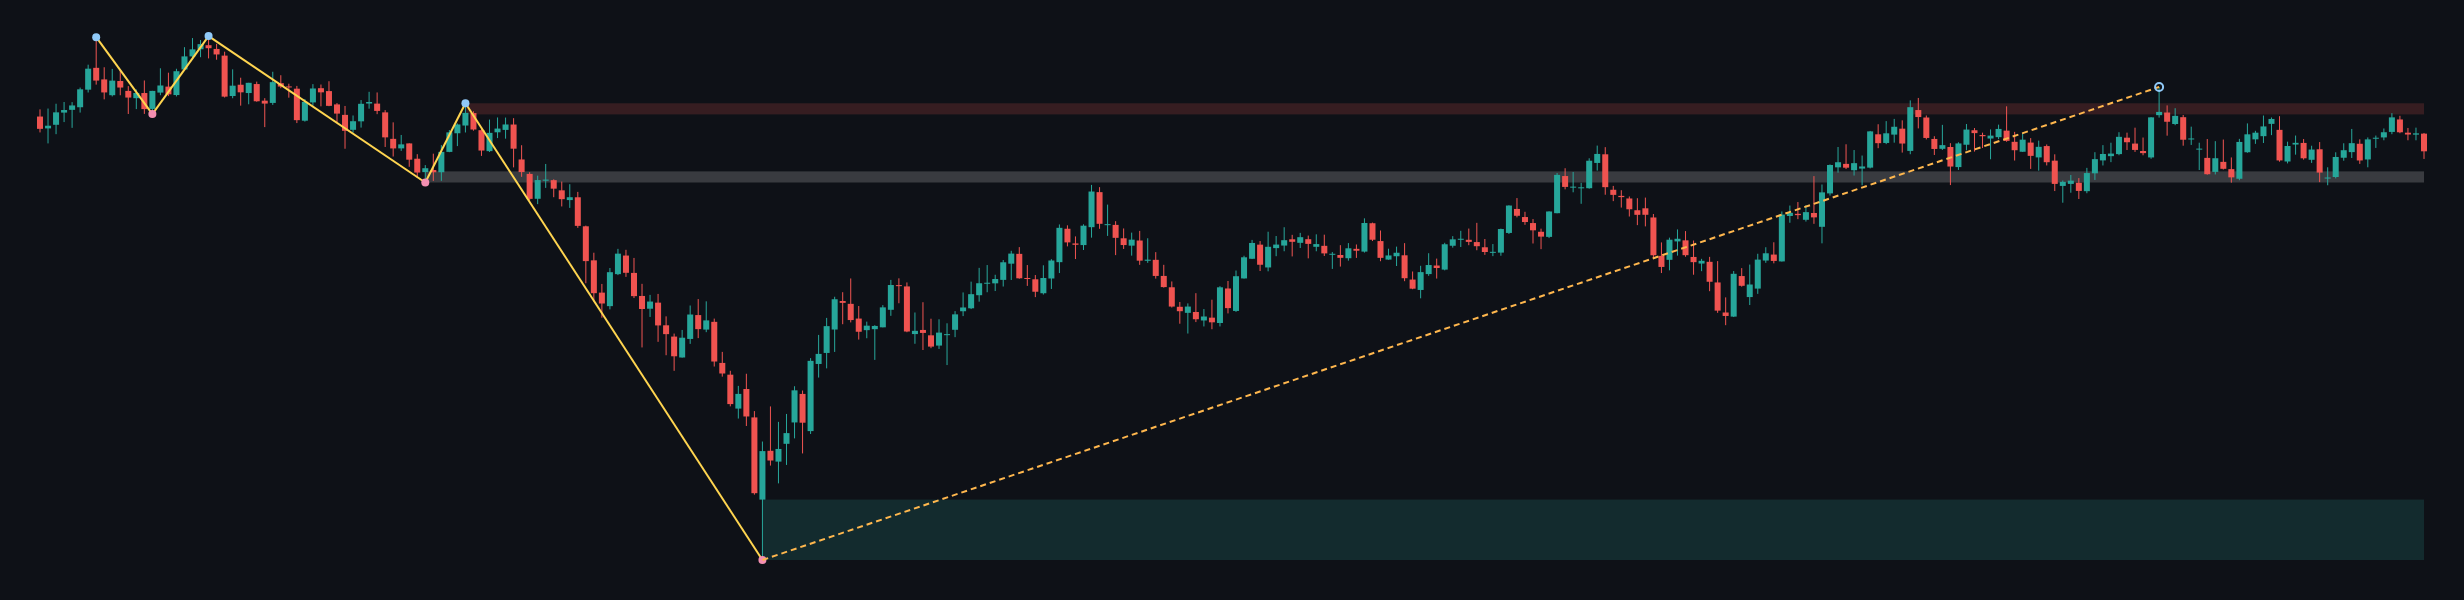
The Weekly structure remains defined by a firm downtrend, although the recent sub-trend has moved upward. No structure event is reported, so there is no confirmed weekly break of structure to resolve that conflict. The most recent confirmed weekly swing is a low at 1.03535.
Price is positioned below the weekly resistance zone at 1.36664–1.37487. A second weekly zone at 1.31602–1.32425 is marked as a broken-retest area, while the broader weekly support zone is 1.03535–1.08025. These zones frame the larger picture: the upward recovery has not yet removed the firm weekly downtrend, and the resistance area remains a major test for any continuation higher.
The Weekly ATR is 0.01646. The report does not provide numerical values for the weekly EMA lines, so their exact position, spacing, and crossover status are not determinable from the data report.
Main-frame structure
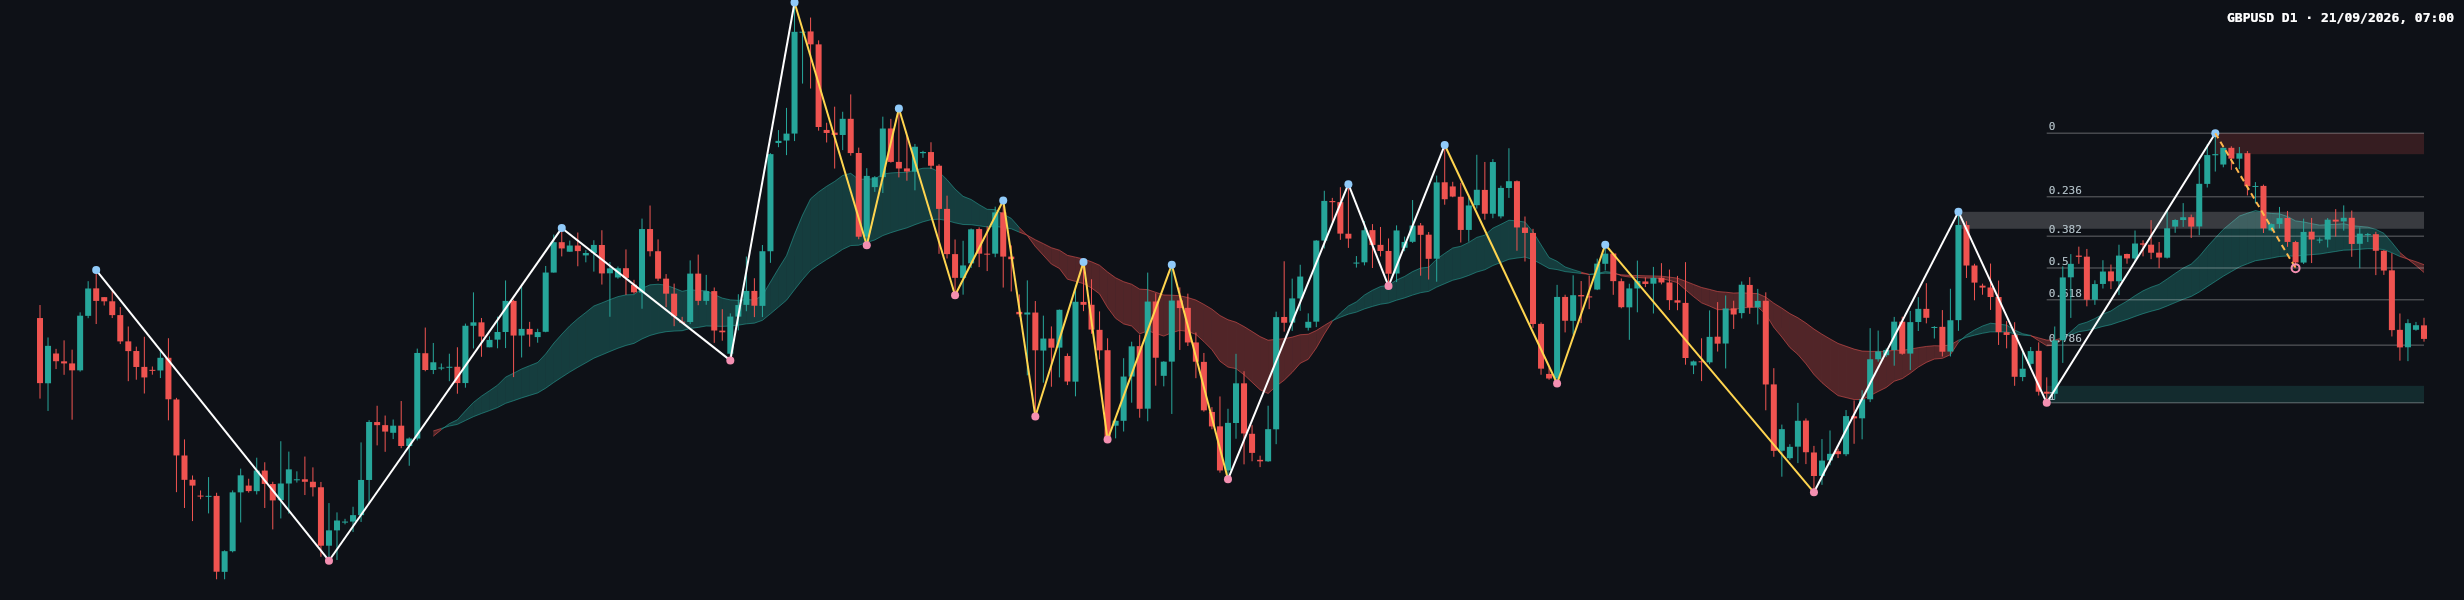
The Daily main trend is firmly up, while the sub-trend is down. This is consistent with a pullback within the broader daily advance rather than a confirmed reversal, because no structure event is reported. The latest confirmed daily swing is a high at 1.36754.
Daily resistance is located at 1.36441–1.36754. The nearest support zone is 1.32730–1.32982, with a broken-retest support zone at 1.35328–1.35580. The Daily ATR is 0.00505. Exact Daily EMA values and their numerical spacing are not included in the report, so those details are not determinable.
The latest completed Dow leg gives the following Fibonacci framework: 0: 1.36754, 0.236: 1.35804, 0.382: 1.35217, 0.5: 1.34742, 0.618: 1.34267, 0.786: 1.33591, and 1: 1.32730. The current retracement ratio is 0.763, placing price close to the 0.786 level at 1.33591. This area is therefore the immediate test of whether the daily uptrend can absorb the current decline.
Recent price action and closing candle
The latest price action shows a retreat from the upper resistance area, followed by consolidation and a renewed move lower toward the Fibonacci region around 1.33591. The final visible bearish movement has pushed the close to 1.33684, close to that retracement reference and above the Daily support zone at 1.32730–1.32982.
The closing candle should be read as a warning of continued seller control in the short-term sub-trend, rather than as a confirmed daily trend reversal. A decisive reaction around 1.33591 would help distinguish a controlled pullback from a broader loss of momentum. The report does not classify the candle by a formal pattern name, and candle-range statistics are not provided, so a precise Marubozu, pin-bar, engulfing, or doji designation is not determinable.
There is no volume or momentum reading in the deterministic report. Accordingly, confirmation must come from price action around the stated Fibonacci levels and support or resistance zones rather than from an unreported indicator.
Key levels
| Area | Level or zone | Role |
|---|---|---|
| Weekly resistance | 1.36664–1.37487 | Higher-timeframe supply |
| Daily resistance | 1.36441–1.36754 | Daily swing-high area |
| Broken-retest resistance/support | 1.35328–1.35580 | Intermediate reaction zone |
| Fibonacci reference | 0.786: 1.33591 | Current retracement test |
| Daily support | 1.32730–1.32982 | Lower boundary for the current pullback |
| Weekly broken-retest zone | 1.31602–1.32425 | Lower higher-timeframe reference |
Conditional scenarios
Bullish scenario
If price stabilizes around 1.33591 and reclaims the broken-retest zone at 1.35328–1.35580, the pullback would show signs of losing momentum. In that case, the next upside area to observe would be 1.36441–1.36754, with the weekly resistance zone at 1.36664–1.37487 providing the broader ceiling. This scenario would be weakened if price instead breaks and holds below 1.32730–1.32982.
Bearish scenario
If price remains below 1.33591 and then breaks the Daily support zone at 1.32730–1.32982, sellers would be showing that the retracement has extended beyond the immediate Fibonacci support. The next higher-timeframe area to observe would be 1.31602–1.32425. A sustained recovery above 1.35328–1.35580 would weaken this bearish interpretation.
Range scenario
If price continues to hold between the Fibonacci reference at 1.33591 and the broken-retest zone at 1.35328–1.35580, the market may remain corrective rather than establish a fresh directional move. A break from this band, followed by acceptance outside it, would provide clearer evidence than an isolated intraday wick.
What matters next
- Watch the reaction at 1.33591, where the current retracement ratio of 0.763 is close to the 0.786 Fibonacci level.
- Monitor 1.32730–1.32982 as the principal Daily support zone and 1.35328–1.35580 as the key broken-retest area above.
- For upside confirmation, price would need to regain 1.35328–1.35580 and then challenge 1.36441–1.36754.
- For downside confirmation, sustained trade below 1.32730–1.32982 would shift attention toward 1.31602–1.32425.
- The weekly resistance band at 1.36664–1.37487 remains important even if the Daily chart resumes its advance.
Closing view
GBPUSD is at a decision area: the Daily trend still permits a recovery, but the Daily sub-trend is down and the Weekly main trend remains firmly bearish. The most informative development would be whether price can defend 1.33591 and return above 1.35328–1.35580, or instead extend below 1.32730–1.32982. Until one of those conditions is met, the evidence favors a corrective market with competing higher- and lower-timeframe signals.
This article is technical analysis and reference information only, not investment advice. Markets carry risk, and readers are responsible for their own decisions.
#GBPUSD #Forex #TechnicalAnalysis #PriceAction #DailyAnalysis
Meta description: GBPUSD Daily analysis of the pullback toward 1.32730–1.32982, with Fibonacci, Weekly context, resistance, support, and conditional scenarios.