
GBPUSD closed at 1.35167. The weekly framework remains a firm downtrend with an upward sub-trend, while the daily framework is a firm uptrend with a downward sub-trend. Price is currently below the daily broken-retest zone at 1.35323–1.35580 and close to the Fibonacci 0.382 level at 1.35217, leaving both continuation and deeper-pullback scenarios open.
Higher-timeframe context
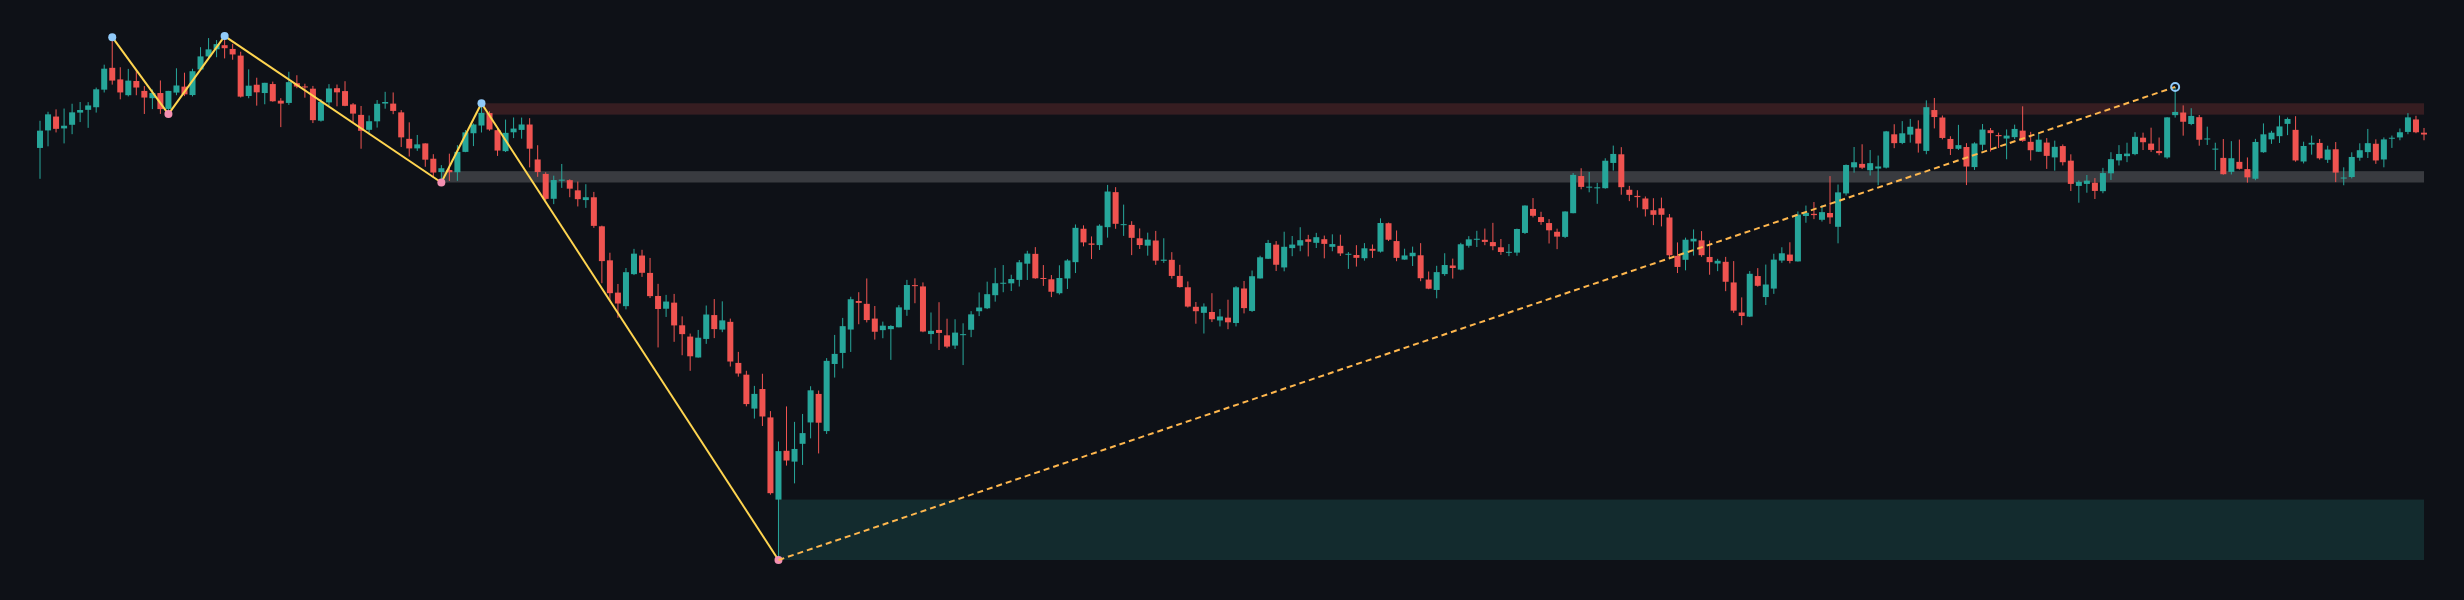
The weekly trend is still classified as down, although the sub-trend is up. The most recent confirmed weekly swing is a low at 1.03535, and no new weekly structure event has been recorded. This means the recovery has not yet changed the primary directional framework.
Price is positioned above the weekly broken-retest resistance zone at 1.31602–1.32440, which now serves as an important structural reference. Above the market, the weekly resistance zone at 1.36649–1.37487 is the major supply area. Below, the broad weekly support zone is 1.03535–1.08025.
The weekly chart does not provide reported values for the moving averages, so their exact position, slope, spacing and any crossover are not determinable from the available data. The weekly ATR is 0.01677, indicating a materially wider higher-timeframe range than the daily ATR of 0.00513.
Overall, the weekly chart permits further upside while price holds above the former 1.31602–1.32440 resistance area, but the primary trend still argues for caution near 1.36649–1.37487.
Main-frame structure
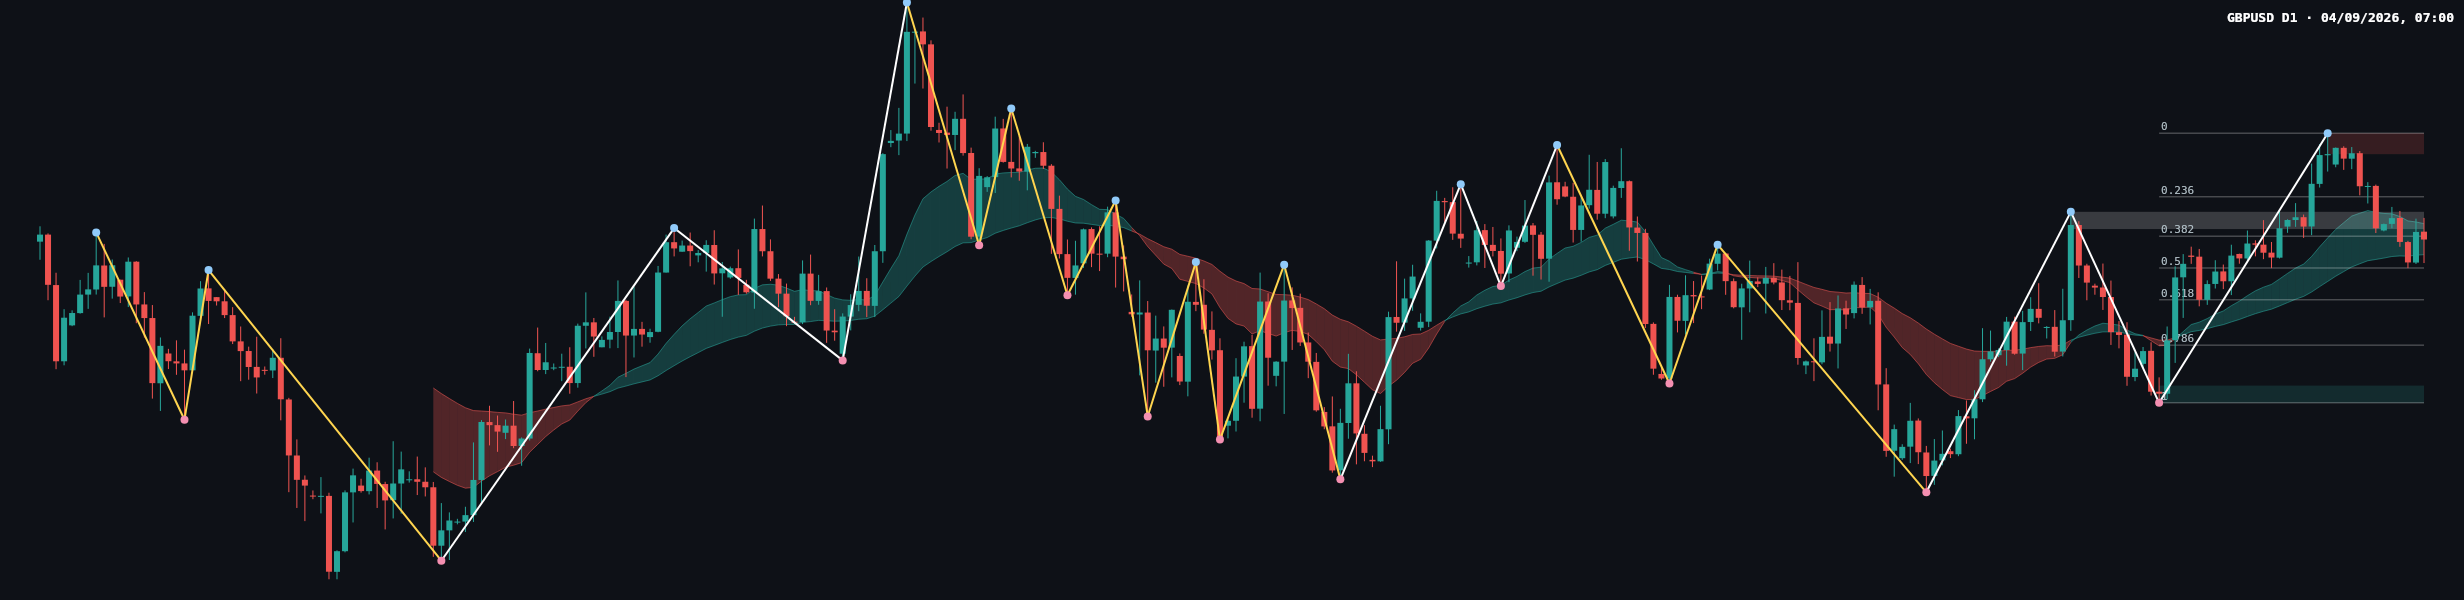
The daily trend is up, while its sub-trend is down. This is a directional mismatch rather than a confirmed reversal: the daily decline can still represent a pullback within the broader uptrend, provided the underlying support structure remains intact.
The latest confirmed daily swing is a high at 1.36754. No daily structure event is reported. The daily resistance zone is 1.36441–1.36754, while the nearest support zone is 1.32730–1.32987. The broken-retest area at 1.35323–1.35580 is currently especially important because the last close at 1.35167 sits below it.
The exact values of the daily moving averages are not provided in the deterministic report. Their visual relationship cannot therefore be stated numerically, and no moving-average crossover should be inferred.
The latest completed Dow leg has Fibonacci levels at 0: 1.36754, 0.236: 1.35804, 0.382: 1.35217, 0.5: 1.34742, 0.618: 1.34267, 0.786: 1.33591, and 1: 1.32730. The current retracement ratio is 0.394, placing price close to the 0.382 reference at 1.35217.
The recent candles show a retreat from the upper part of the latest swing, followed by trading around the Fibonacci and broken-retest references. The available report does not classify each candle by exact body or wick measurements, so a precise candle-by-candle comparison is not determinable. The broader message is that sellers have controlled the pullback, but buyers are approaching a clearly defined reaction area.
Key levels and the latest close
| Reference | Level or zone | Role |
|---|---|---|
| Last closed price | 1.35167 | Current reference |
| Daily broken-retest zone | 1.35323–1.35580 | Overhead recovery test |
| Fibonacci reference | 0.382: 1.35217 | Current retracement area |
| Daily resistance | 1.36441–1.36754 | Upper supply zone |
| Daily support | 1.32730–1.32987 | Lower demand zone |
| Next Fibonacci references | 0.5: 1.34742 and 0.618: 1.34267 | Deeper pullback references |
The latest close is below the daily broken-retest zone and slightly below the 0.382 Fibonacci level. The report does not provide a formal candle label, such as a pin bar or engulfing candle, so the latest candle should be treated as a close with unresolved follow-through rather than assigned a specific pattern.
Scenarios
Bullish scenario
If price reclaims and holds above 1.35323–1.35580, the broken-retest zone would be recovered and the pullback could lose momentum. A sustained move through this area would bring 1.35804 into view, followed by the daily resistance zone at 1.36441–1.36754. This scenario would be invalidated by renewed acceptance below 1.35217 and continued trading beneath 1.35323–1.35580.
Bearish scenario
If price remains below 1.35323–1.35580 and breaks lower from the current Fibonacci area around 1.35217, the retracement could extend toward 1.34742 and then 1.34267. A deeper daily decline could expose the 1.32730–1.32987 support zone. Recovery back above 1.35323–1.35580 would weaken this bearish path.
Range scenario
Price may continue to oscillate between the broken-retest zone at 1.35323–1.35580 and the Fibonacci references at 1.35217 and 1.34742 without producing a decisive structure event. In this case, the market would remain balanced between a possible reclaim and a deeper pullback. A sustained move beyond either side of this area would be needed to reduce the range interpretation.
Closing assessment
The daily trend remains up, but the immediate sub-trend is down and price is testing a consequential area near 1.35217. The bullish case requires recovery of 1.35323–1.35580, while failure to regain that zone keeps 1.34742, 1.34267 and potentially 1.32730–1.32987 in focus. The weekly backdrop favors measured interpretation because the primary trend is still down despite the upward sub-trend.
This article is technical analysis for reference only and is not investment advice. Markets carry risk, and readers are responsible for their own decisions.