
GBPUSD closed at 1.35486 on the daily frame, placing the market inside the daily broken-retest support zone at 1.35335–1.35580. The immediate picture is mixed: the daily trend is firmly up, while the weekly trend remains firmly down. This conflict leaves the current zone as an important test of whether the daily advance can continue or whether the broader bearish framework will regain control.
Higher-timeframe context
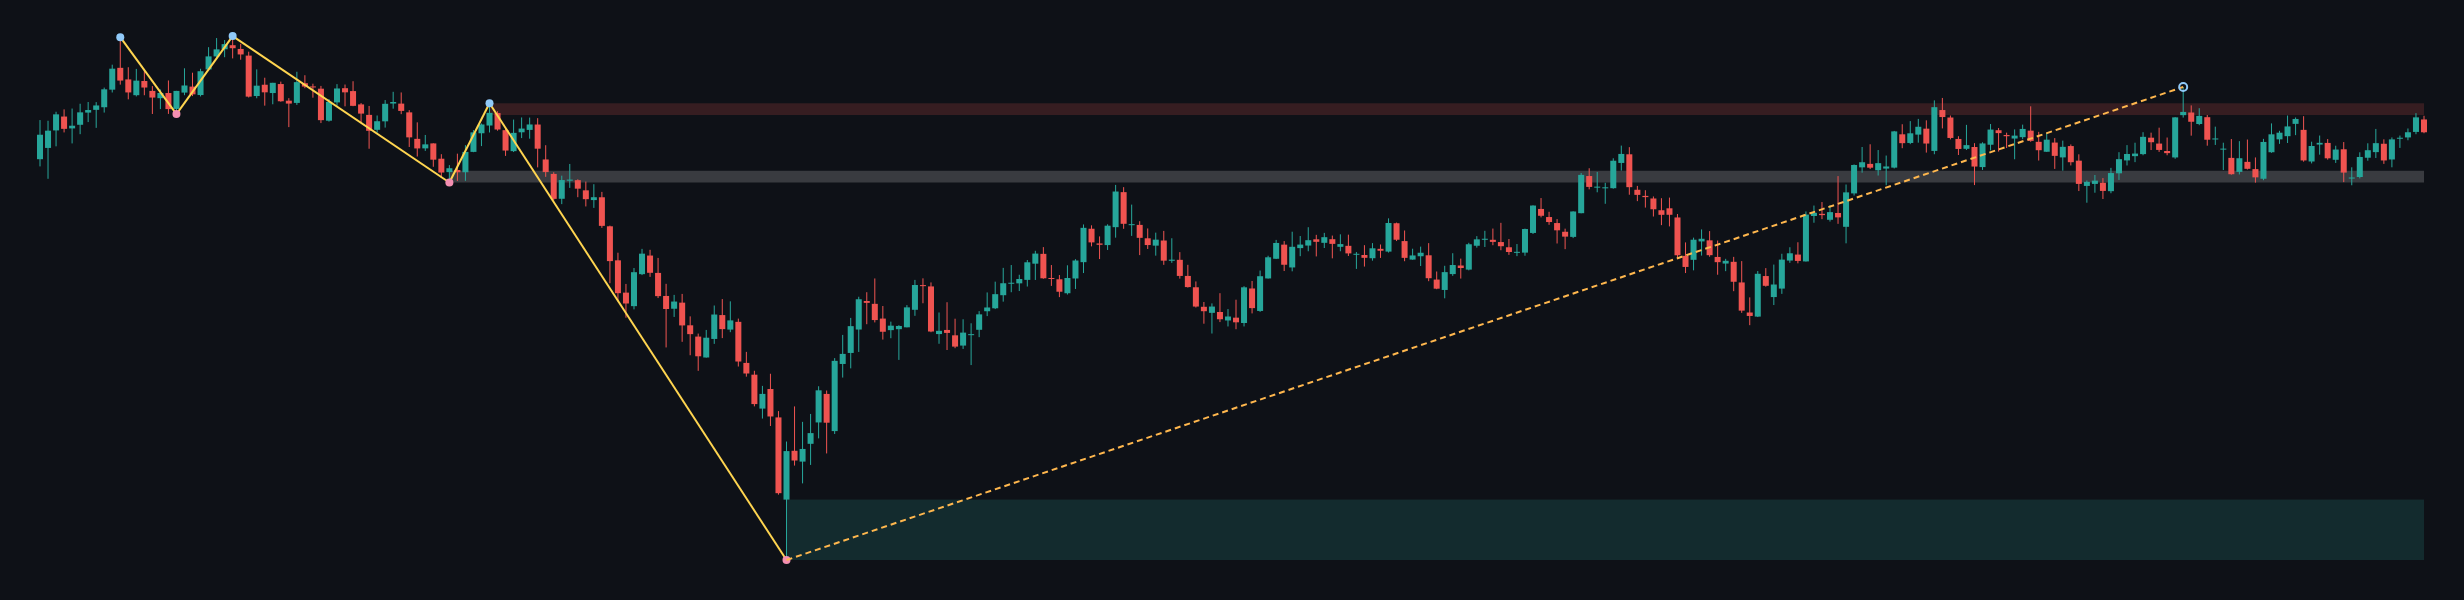
The weekly chart shows a firm downtrend with an upward sub-trend. The most recent confirmed weekly swing is a low at 1.03535, and no weekly structure event has been recorded. This means the rising sub-trend has not yet changed the primary weekly direction.
Price is below the weekly resistance zone at 1.36619–1.37487, while the broken-retest resistance zone at 1.31602–1.32470 lies beneath the current weekly close. The larger weekly support zone is marked at 1.03535–1.08025. These zones frame a market that has recovered substantially from the confirmed swing low but remains beneath important higher-timeframe resistance.
The weekly report does not provide a separate Fibonacci study. The available Fibonacci data belongs to the latest completed daily Dow leg, so no weekly Fibonacci interaction should be inferred.
Main-frame structure
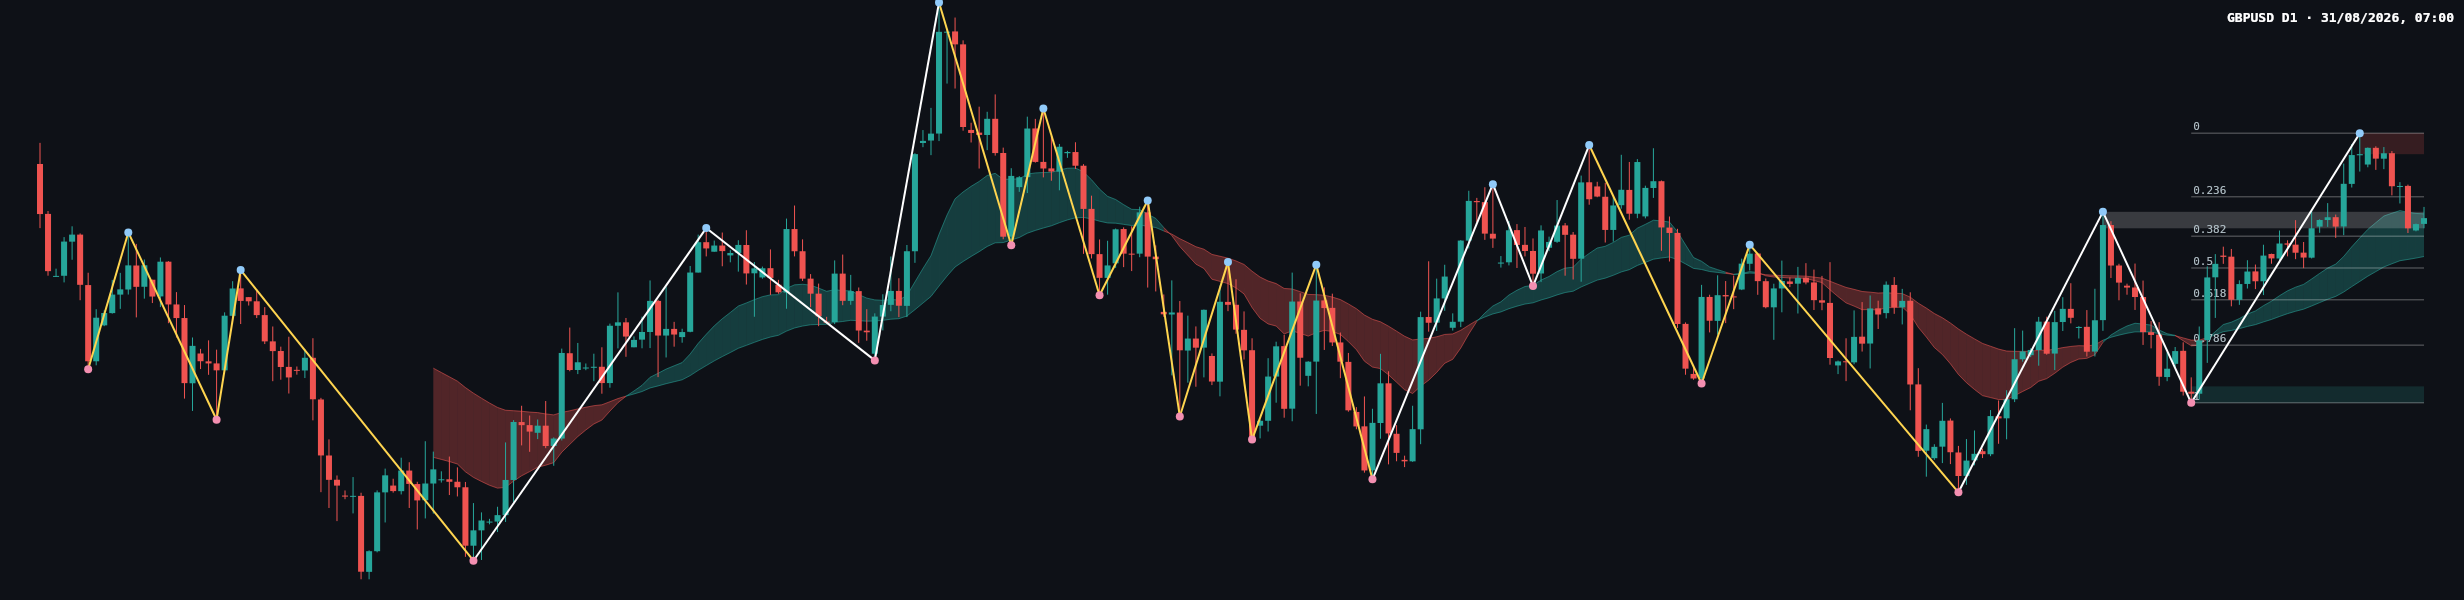
The daily chart maintains a firm uptrend, but its sub-trend is down. That combination describes a pullback within the larger daily advance rather than a confirmed reversal. No daily structure event has been recorded, and the most recent confirmed swing is a high at 1.36754.
The daily resistance zone is 1.36441–1.36754. Beneath the market, the nearest marked support is the broken-retest zone at 1.35335–1.35580, followed by the broader support zone at 1.32730–1.32975. The daily moving-average overlay is visible on the chart, but exact moving-average values are not included in the deterministic report; their precise spacing and slope are therefore not determinable from the supplied data.
The latest completed daily Dow leg runs from 1.36754 to 1.32730. Its Fibonacci levels are 1.35804 at ratio 0.236, 1.35217 at ratio 0.382, 1.34742 at ratio 0.5, 1.34267 at ratio 0.618, and 1.33591 at ratio 0.786. The current retracement ratio is 0.315, placing price between the 0.236 and 0.382 retracement references.
Key levels
| Area | Level or zone | Role |
|---|---|---|
| Daily resistance | 1.36441–1.36754 | Recovery must overcome this zone to challenge the recent confirmed high. |
| Weekly resistance | 1.36619–1.37487 | Higher-timeframe supply area that overlaps the daily resistance region. |
| Broken-retest support | 1.35335–1.35580 | Immediate test for the daily pullback. |
| Daily Fibonacci reference | 1.35804 and 1.35217 | Retracement references around the current price. |
| Broader daily support | 1.32730–1.32975 | Lower support if the immediate retest fails. |
Scenarios
Primary scenario: support holds and recovery develops
If price remains accepted above 1.35335–1.35580 and reclaims 1.35804, the daily pullback may be treated as a contained correction. A continued recovery would bring the daily resistance zone at 1.36441–1.36754 into focus. This scenario is invalidated by sustained acceptance below 1.35335–1.35580. The deterministic report does not provide probability estimates.
Secondary scenario: range continuation around the retest
If price continues to oscillate between the broken-retest support at 1.35335–1.35580 and the Fibonacci reference at 1.35804, the market may remain rotational rather than establish a clear directional move. A break away from this area would be needed to improve directional clarity. This scenario loses relevance if price establishes above 1.35804 or below 1.35217. The deterministic report does not provide probability estimates.
Risk scenario: support failure and deeper retracement
If price breaks below 1.35335–1.35580 and follows through beneath 1.35217, sellers could extend the daily sub-trend lower toward 1.34742, 1.34267, or the broader support zone at 1.32730–1.32975. This bearish scenario is invalidated if price reclaims and holds above 1.35804. The deterministic report does not provide probability estimates.
Recent candle and market behaviour
The latest candle should be read in relation to the immediate broken-retest zone rather than in isolation. Recent price action shows a recovery from the lower daily swing area, followed by hesitation beneath the upper resistance region. The latest close at 1.35486 sits within the marked support zone, so the candle represents a test of acceptance or rejection at that area. Exact candle classification, range comparison, and close placement within the candle are not supplied in the deterministic report and are not determinable with sufficient precision from the data alone.
The buyer-versus-seller balance is therefore conditional. Holding above 1.35335–1.35580 would support the case for buyers defending the retest, while a close below 1.35217 would show that sellers are extending the pullback through a key Fibonacci reference. No volume or momentum reading is included in the report.
What to monitor
- Whether price holds the daily broken-retest zone at 1.35335–1.35580.
- Whether 1.35804 is reclaimed and retained during a recovery.
- Whether the market reaches the overlapping daily and weekly resistance areas at 1.36441–1.36754 and 1.36619–1.37487.
- Whether a break beneath 1.35217 opens a path toward 1.34742 and 1.34267.
- Whether broader support at 1.32730–1.32975 becomes relevant after an extended decline.
False breaks and liquidity sweeps around the retest zone remain possible, particularly while the daily and weekly trends disagree. Confirmation would be stronger if a move beyond a marked level were followed by sustained acceptance rather than an isolated intraday excursion.
No news or economic-calendar information was supplied with the report. Traders should independently monitor scheduled macroeconomic releases, central-bank communication, currency-market drivers, and changes in volatility. General risk principles remain important: avoid relying on a single level, account for gap and slippage risk, and use exposure appropriate to personal circumstances.
Summary
- The weekly trend is firmly down, with an upward sub-trend and no recorded structure event.
- The daily trend is firmly up, but the sub-trend is down and price is testing 1.35335–1.35580.
- A recovery through 1.35804 would shift attention toward 1.36441–1.36754.
- A sustained move below 1.35217 would strengthen the deeper-retracement case toward 1.34742 and 1.34267.
The single most important factor is whether GBPUSD can maintain acceptance above 1.35335–1.35580 while the broader weekly downtrend remains active.
#GBPUSD #ForexAnalysis #PriceAction #DowTheory #TechnicalAnalysis
Meta description: GBPUSD tests daily support at 1.35335–1.35580 as a firm daily uptrend conflicts with the broader weekly downtrend.
This article is technical analysis and reference information only, not investment advice. Markets carry risk, and readers are responsible for their own decisions.