
GBPUSD closed at 1.35334. The weekly framework still shows a firm downtrend with an upward sub-trend, while the daily framework remains firmly upward with a downward sub-trend. This conflict places attention on the daily broken-retest support zone at 1.35313 – 1.35580, with the nearby Fibonacci level at 1.35217 offering an additional test of selling pressure.
Higher-timeframe context
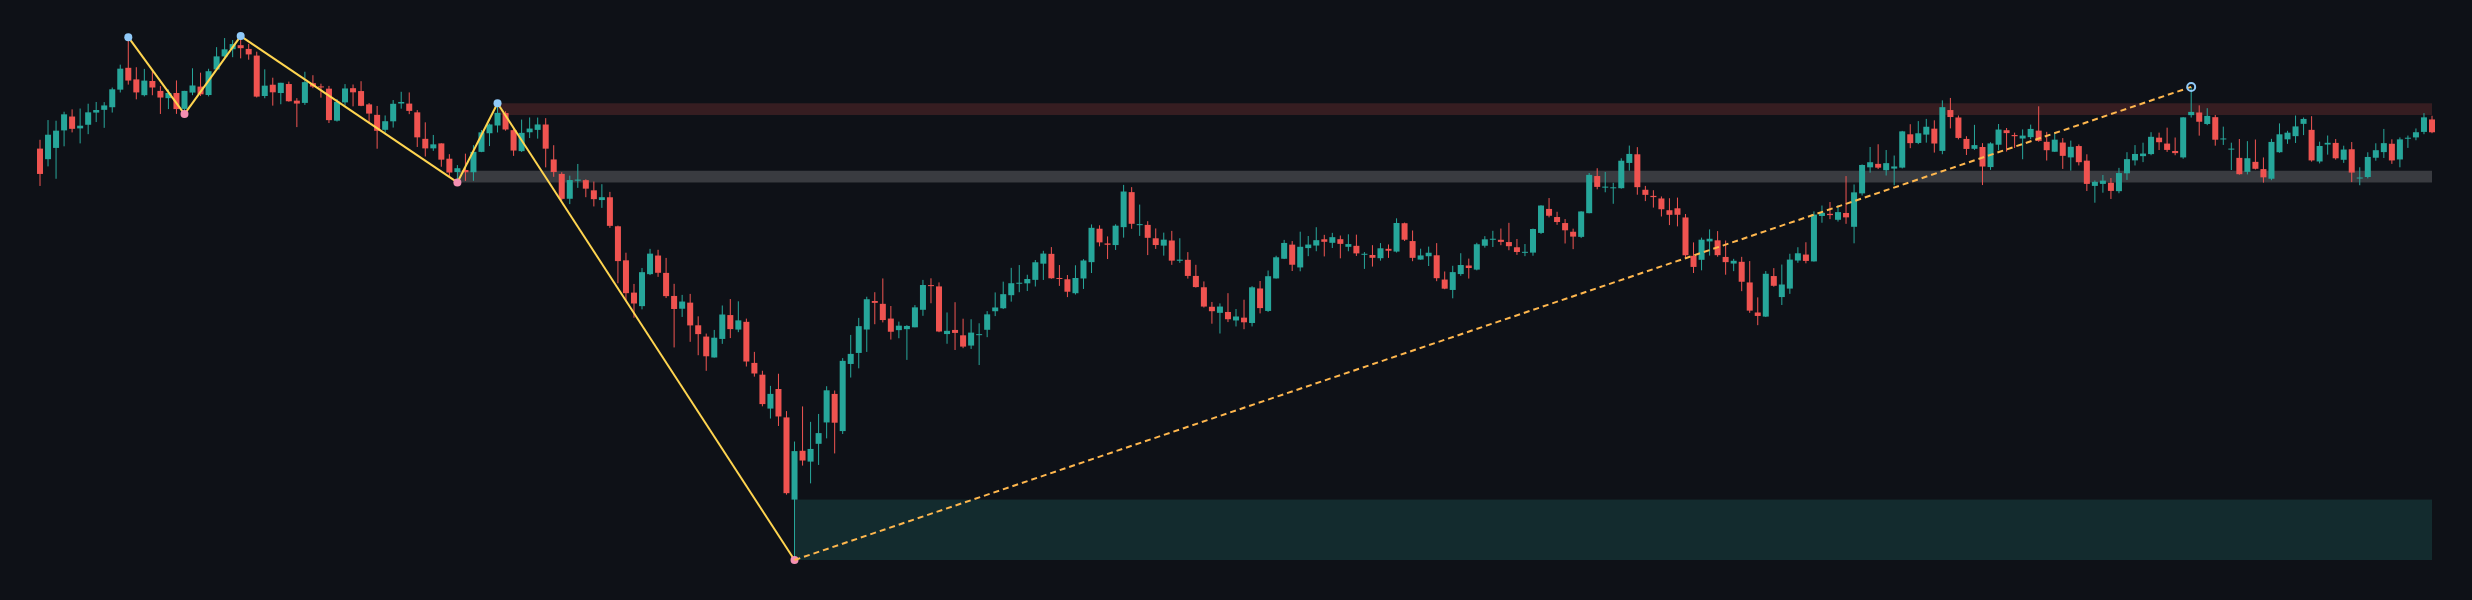
The weekly main trend is down and remains firm, although the sub-trend is up. No weekly structure event is recorded, so the recent recovery has not yet produced a confirmed change in the dominant Dow structure. The most recent confirmed weekly swing is the low at 1.03535.
Price is trading below the weekly resistance zone at 1.36619 – 1.37487. It is also above the broken-retest resistance zone at 1.31602 – 1.32470, which now provides an important reference area below the market. The broader weekly support zone is 1.03535 – 1.08025.
The weekly ATR is 0.01736. Weekly EMA values, their slopes, and any crossover are not determinable from the deterministic report, so no conclusion is drawn about price relative to those averages.
Weekly conclusion
The higher timeframe permits further recovery while price holds above the broken-retest area at 1.31602 – 1.32470, but the weekly resistance at 1.36619 – 1.37487 remains the key ceiling. The weekly trend therefore favors caution around resistance rather than assuming that the daily recovery has become a lasting reversal.
Main-frame structure
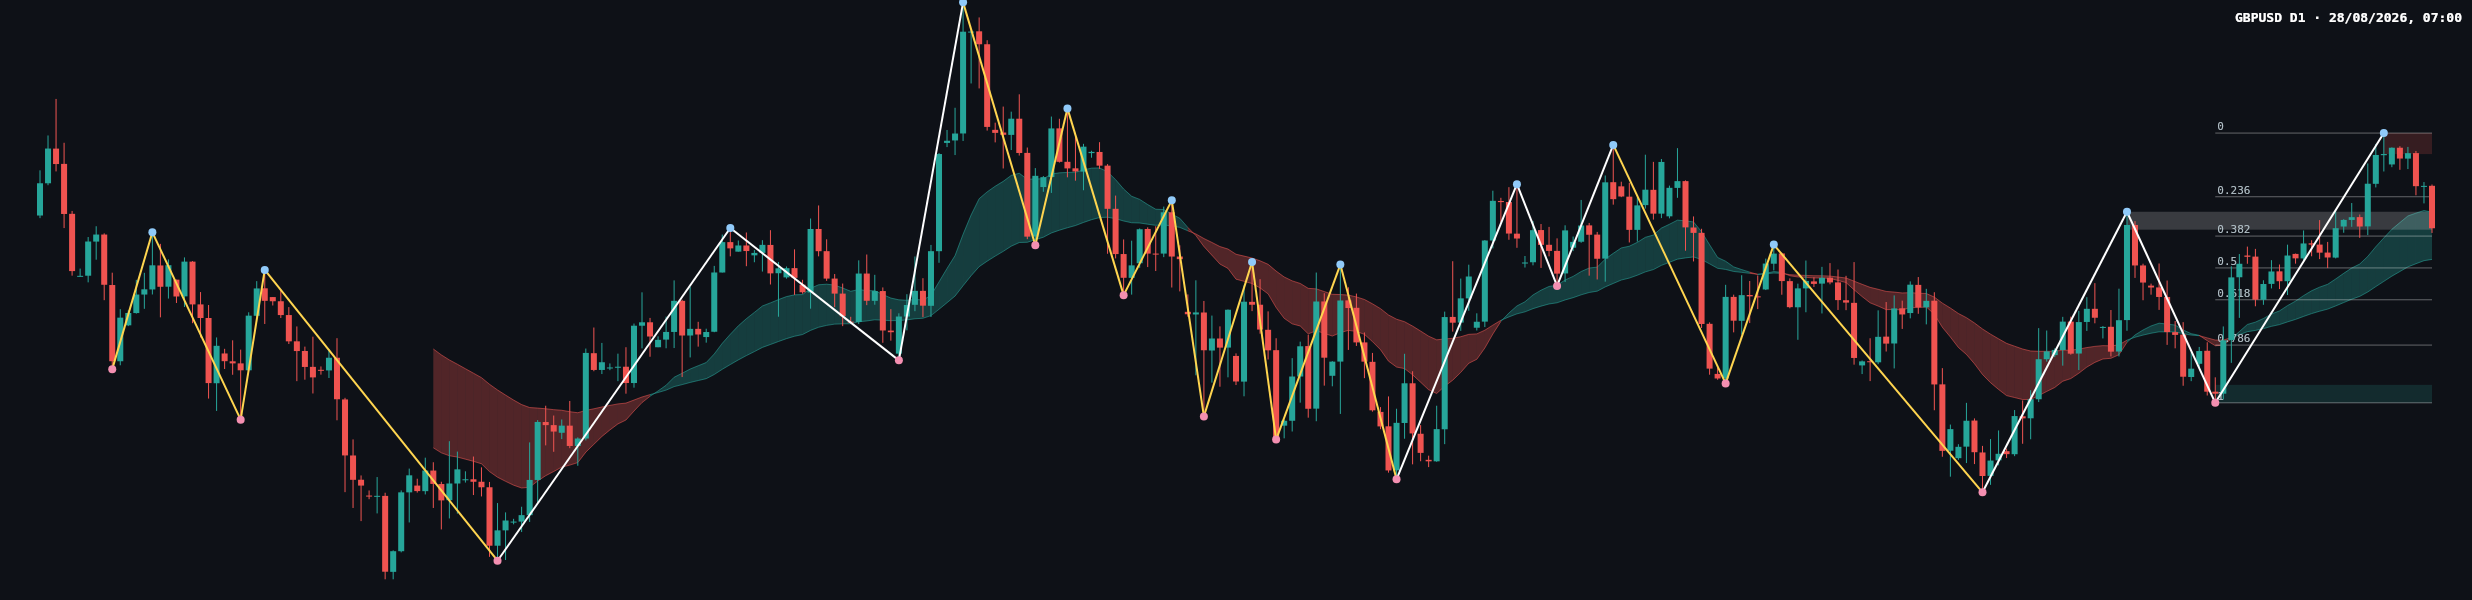
On the daily chart, the main trend is up and firm, while the sub-trend is down. This is currently better classified as a pullback within the daily advance than as a confirmed reversal because no daily structure event is recorded.
The latest confirmed daily swing high is 1.36754. The daily resistance zone is 1.36441 – 1.36754, aligning the recent swing high with the upper decision area. The nearest broader daily support is 1.32730 – 1.32997, while the immediate broken-retest zone is 1.35313 – 1.35580.
The daily ATR is 0.00534. Daily EMA values and their exact relationship to price are not provided in the report; consequently, their spacing, slope, and any crossover are not determinable here.
The latest completed Dow leg has a Fibonacci retracement ratio of 0.353. Price is close to the 0.382 level at 1.35217, after trading from the swing high at 1.36754 toward lower retracement levels. The remaining reference levels are 1.35804 at 0.236, 1.34742 at 0.5, 1.34267 at 0.618, 1.33591 at 0.786, and 1.32730 at 1.
Recent daily candles
The most recent candles show a retreat from the area around 1.36754, followed by a move back toward the broken-retest zone at 1.35313 – 1.35580. The latest visible candle is bearish, with the close at 1.35334 positioned near the lower part of the immediate zone. The preceding candles show a loss of upside follow-through after the advance toward resistance, while alternating candle bodies and wicks indicate a contest rather than a clean directional break.
The buyer-versus-seller story is therefore conditional. Sellers have gained short-term control from the resistance area, but buyers still have an opportunity to defend the retest zone. A sustained move below 1.35313 would make the pullback more consequential; a recovery above 1.35580 would suggest that demand is absorbing the recent pressure.
Volume and momentum readings are not included in the deterministic report, so confirmation or divergence from those measures is not determinable.
Key levels
| Reference | Level | Technical role |
|---|---|---|
| Daily resistance | 1.36441 – 1.36754 | Recent high and primary upside barrier |
| Weekly resistance | 1.36619 – 1.37487 | Higher-timeframe supply area |
| Immediate retest zone | 1.35313 – 1.35580 | Decision area around the latest close |
| Fibonacci level | 1.35217 | 0.382 retracement reference |
| Daily support | 1.32730 – 1.32997 | Lower support if the pullback extends |
| Weekly broken-retest area | 1.31602 – 1.32470 | Broader structural support reference |
Scenarios
Primary scenario: defence of the retest zone
If price holds the immediate zone at 1.35313 – 1.35580 and regains the upper boundary at 1.35580, the daily uptrend may resume. The next resistance area to monitor would be 1.36441 – 1.36754, with the weekly supply zone at 1.36619 – 1.37487 becoming increasingly relevant. This scenario is invalidated by sustained acceptance below 1.35313.
Secondary scenario: continuation of the daily pullback
If sellers press below 1.35313 and price also moves through the Fibonacci reference at 1.35217, the pullback can extend toward 1.34742 and then the broader daily support zone at 1.32730 – 1.32997. This would weaken the daily recovery without, by itself, removing the weekly broken-retest support at 1.31602 – 1.32470. The scenario is invalidated by a recovery above 1.35580.
Risk scenario: upside break into weekly supply
If price breaks above 1.36754, the move would clear the latest daily swing high and bring the weekly resistance zone at 1.36619 – 1.37487 into direct focus. A failure to hold above 1.36441 after that break would warn of rejection rather than confirmed continuation. The upside scenario is invalidated by a return below 1.35313.
Among these outcomes, the immediate bias is cautiously balanced with a slight bullish tilt while 1.35313 – 1.35580 holds, but the weekly downtrend and nearby resistance limit the quality of any upside continuation.
Session considerations
- Levels to watch: monitor 1.35580, 1.35313, and 1.35217 first; wider references are 1.36441 – 1.36754, 1.32730 – 1.32997, and 1.31602 – 1.32470.
- Confirmation: a daily close above 1.35580 would support demand at the retest zone, while a daily close below 1.35313 would strengthen the bearish pullback case.
- Traps: a brief move through either edge of 1.35313 – 1.35580 followed by a close back inside the zone would represent a possible false break and should be treated cautiously.
- Fundamentals: the report provides no scheduled-news information. DXY, US yields, economic releases, central-bank communication, and geopolitical headlines can all alter the technical response.
- Risk management: readers should account for volatility, avoid assuming that a level will hold, and use a risk plan appropriate to their circumstances. This analysis does not specify entries, stops, targets, or position size.
Summary
- The weekly trend is down and firm, while the sub-trend is up.
- The daily trend is up and firm, but its sub-trend is down.
- The immediate decision area is 1.35313 – 1.35580, with Fibonacci support nearby at 1.35217.
- A recovery above 1.35580 would refocus attention on 1.36441 – 1.36754.
- A sustained break below 1.35313 would expose 1.34742 and the broader support at 1.32730 – 1.32997.
The single most important thing today is how price behaves around 1.35313 – 1.35580.
Tags: GBPUSD, forex, technical analysis, price action, Dow Theory
Meta description: GBPUSD tests 1.35313 – 1.35580 as weekly and daily trends diverge. Key scenarios use resistance, support, and Fibonacci references.
This article is technical analysis and reference information only, not investment advice. Markets carry risk, and readers are responsible for their own decisions.