
GBPUSD is holding a constructive daily structure, with the latest closed price at 1.36454 and a confirmed break of structure above 1.35580. The broader weekly trend remains firmly down despite an upward sub-trend, placing the market at an important conflict point: daily momentum is bullish, while the higher-timeframe price is approaching resistance at 1.36602 – 1.37487.
Higher-timeframe context
The weekly framework remains bearish overall, with the main trend classified as down and the sub-trend classified as up. The most recent confirmed weekly swing is the low at 1.03535, and no new weekly structure event has been confirmed. This means the current advance can still be read as a recovery within a larger downtrend rather than a confirmed long-term reversal.
Price is now pressing toward the weekly resistance zone at 1.36602 – 1.37487. A sustained move through that area would improve the case that the weekly sub-trend is developing into a broader reversal. Conversely, rejection from the zone would preserve the dominant weekly downtrend.
The earlier weekly resistance zone at 1.31602 – 1.32487 is marked as a broken-retest area. Its role has therefore shifted from overhead resistance toward a historical reference zone beneath the current market. The wider weekly support zone is located at 1.03535 – 1.08025.
Weekly average values and their exact spacing are not determinable from the deterministic report. Weekly Fibonacci levels are also not supplied, so interaction with a weekly Fibonacci level cannot be confirmed.
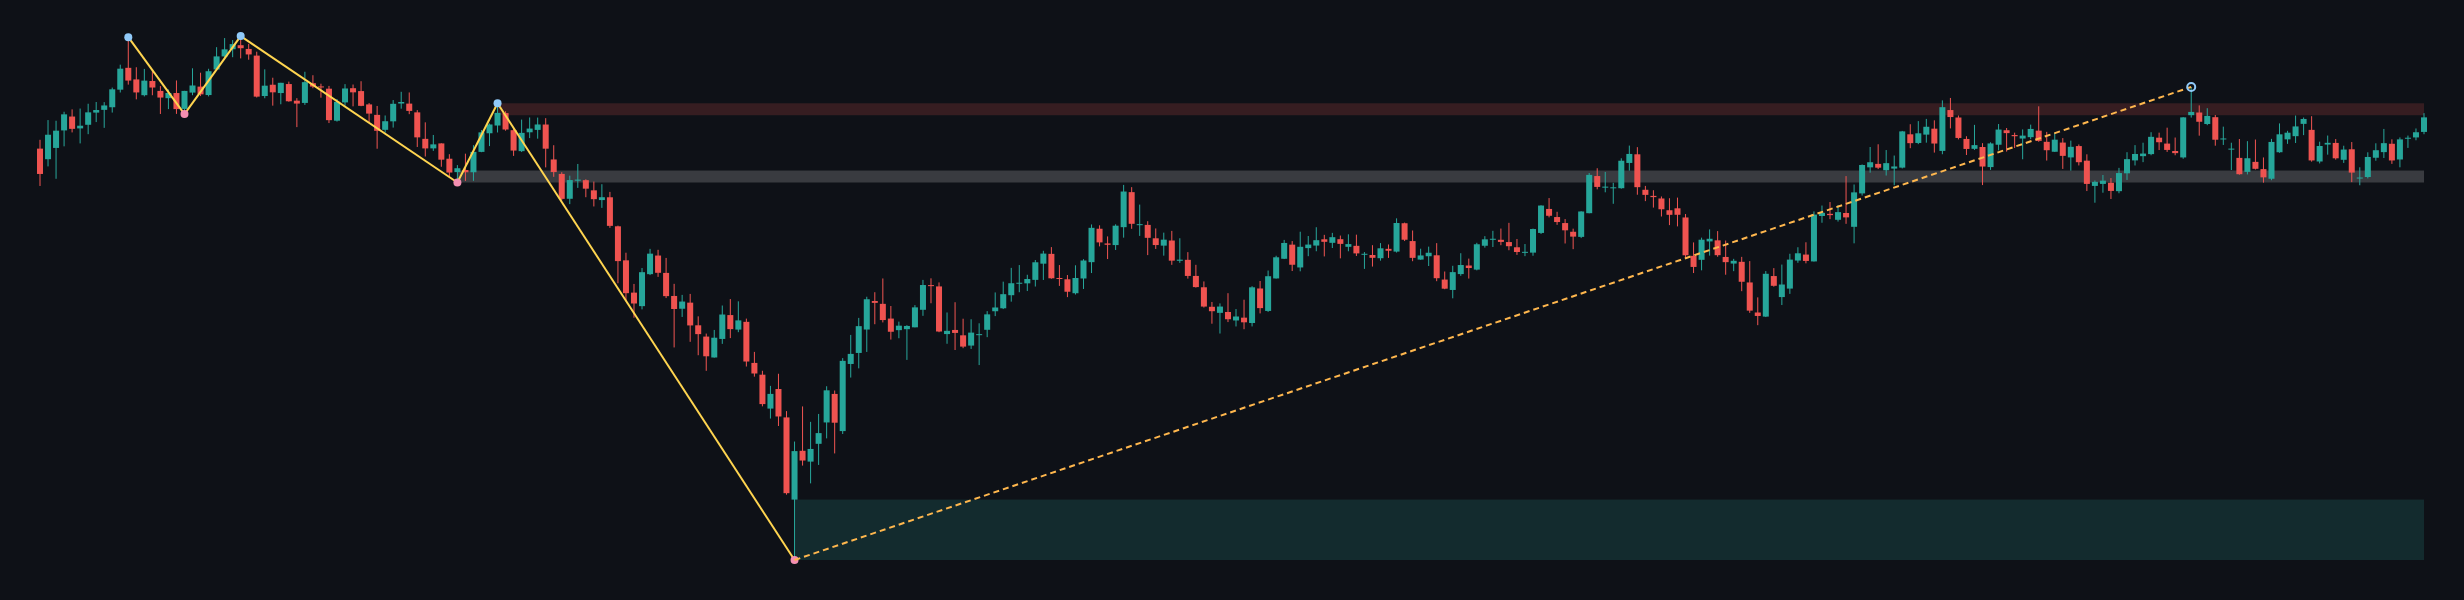
Weekly conclusion: The higher timeframe permits further upside while price remains above the broken-retest region, but the dominant weekly trend still favors caution near 1.36602 – 1.37487.
Main-frame structure
The daily chart is aligned upward, with both the main trend and sub-trend classified as up. The key structural event is a bullish break of structure above 1.35580. The latest confirmed daily swing low is 1.32730, which remains the principal structural reference beneath the advance.
Daily resistance is defined by 1.35317 – 1.35580. Since the break occurred above 1.35580, this zone becomes an important test of whether the bullish move can hold its newly established structure. Daily support is found at 1.32730 – 1.32993, while 1.34827 – 1.35090 is identified as a broken-retest support area.
The daily Fibonacci leg runs from 0: 1.32730 to 1: 1.35580. Its intermediate levels are 0.236: 1.33403, 0.382: 1.33819, 0.5: 1.34155, 0.618: 1.34491, and 0.786: 1.34970. The current retracement ratio is 1.000, indicating that price has reached the completed-leg endpoint rather than testing an intermediate retracement.
The exact daily moving-average values, their slopes, and any crossover are not determinable from the report. The chart does show the moving-average structure beneath the latest advance, but the available data does not support assigning exact values or a formal crossover condition.
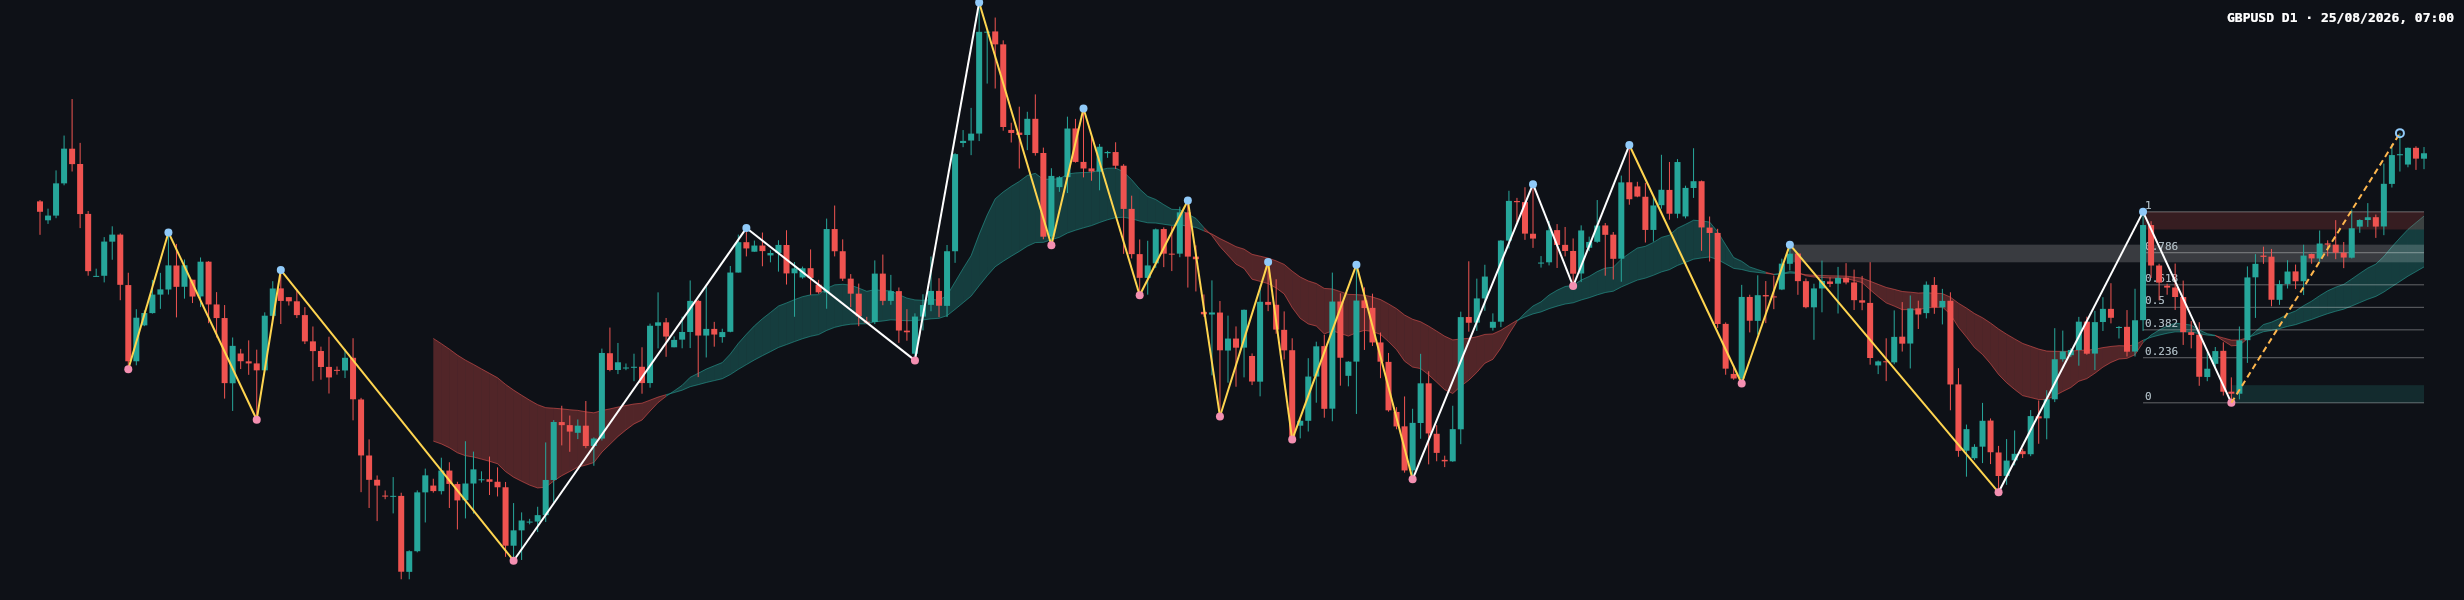
Daily conclusion: The daily structure favors continuation while the market holds above the broken resistance at 1.35580. The principal challenge is the weekly resistance zone at 1.36602 – 1.37487, where the bullish daily trend may encounter higher-timeframe supply.
Recent price action
The latest candles show a strong recovery from the recent daily swing low at 1.32730, followed by a break above 1.35580. The most recent close at 1.36454 remains above the daily resistance zone at 1.35317 – 1.35580, which supports the continuation argument.
The precise body-to-wick classification of each recent candle is not available in the deterministic report, so a formal label such as pin bar, doji, or engulfing candle cannot be confirmed. The visible chart nevertheless shows buyers maintaining control through the latest advance, with price holding near the upper part of the recent range rather than returning immediately to the broken-retest support at 1.34827 – 1.35090.
There is no volume or momentum reading in the deterministic report. Any volume confirmation or divergence is therefore not determinable from the supplied data.
Scenarios
Bullish continuation
If price establishes acceptance above the weekly resistance zone at 1.36602 – 1.37487, the daily break of structure would receive higher-timeframe confirmation. The relevant upside area is the remainder of that resistance zone. This scenario would be weakened if price falls back below the broken daily level at 1.35580.
Range and consolidation
If price remains below 1.36602 – 1.37487 while holding above the broken daily resistance zone at 1.35317 – 1.35580, consolidation between these areas would be consistent with a market balancing after the daily structural break. The scenario would lose relevance if price either achieves sustained acceptance above weekly resistance or breaks back below 1.35317.
Bearish rejection
If the weekly resistance zone rejects price and the daily market closes back below 1.35317 – 1.35580, the bullish break would be treated as vulnerable to a failed retest. The next daily support reference is the broken-retest area at 1.34827 – 1.35090. A deeper deterioration would bring attention to 1.32730 – 1.32993, with the confirmed swing low at 1.32730 acting as the broader daily invalidation reference for the current upward structure.
Key levels and confirmation checklist
- Weekly resistance: 1.36602 – 1.37487.
- Daily resistance and structural break: 1.35317 – 1.35580.
- Daily broken-retest support: 1.34827 – 1.35090.
- Daily support: 1.32730 – 1.32993.
- Weekly broken-retest reference: 1.31602 – 1.32487.
The cleanest bullish confirmation would be sustained daily acceptance above 1.36602, followed by continued respect for the broken daily structure at 1.35580. A bearish warning would be a return below 1.35317 – 1.35580, particularly if the market then fails to hold 1.34827 – 1.35090.
The daily ATR is 0.00525, while the weekly ATR is 0.01770. These readings indicate that volatility should be considered when interpreting moves around the marked zones, without implying a fixed future range.
Summary
- The weekly main trend is down, although the sub-trend is up.
- The daily main trend and sub-trend are both up.
- A daily break of structure occurred above 1.35580.
- The main decision area is weekly resistance at 1.36602 – 1.37487.
- Holding above 1.35317 – 1.35580 keeps the daily continuation case intact; rejection through that area raises the risk of a move toward 1.34827 – 1.35090.
The single most important consideration is whether price can sustain acceptance above 1.36602 – 1.37487 without losing the daily break level at 1.35580.
#GBPUSD #Forex #PriceAction #DowTheory #TechnicalAnalysis
Meta description: GBPUSD daily analysis covering bullish structure, weekly resistance, key support zones, Fibonacci context, and conditional market scenarios.
This article is technical analysis and reference information only, not investment advice. Markets carry risk, and readers are responsible for their own decisions.