
GBPUSD retains a constructive technical structure, with the weekly main trend described as up and the daily trend also up. The daily chart shows a confirmed BOS through 1.35580, while the latest closed price is 1.36535. Price is therefore holding above the broken level and approaching the higher-timeframe resistance zone at 1.36985–1.37884, making that area the main test for continuation.
Higher-timeframe context — Weekly
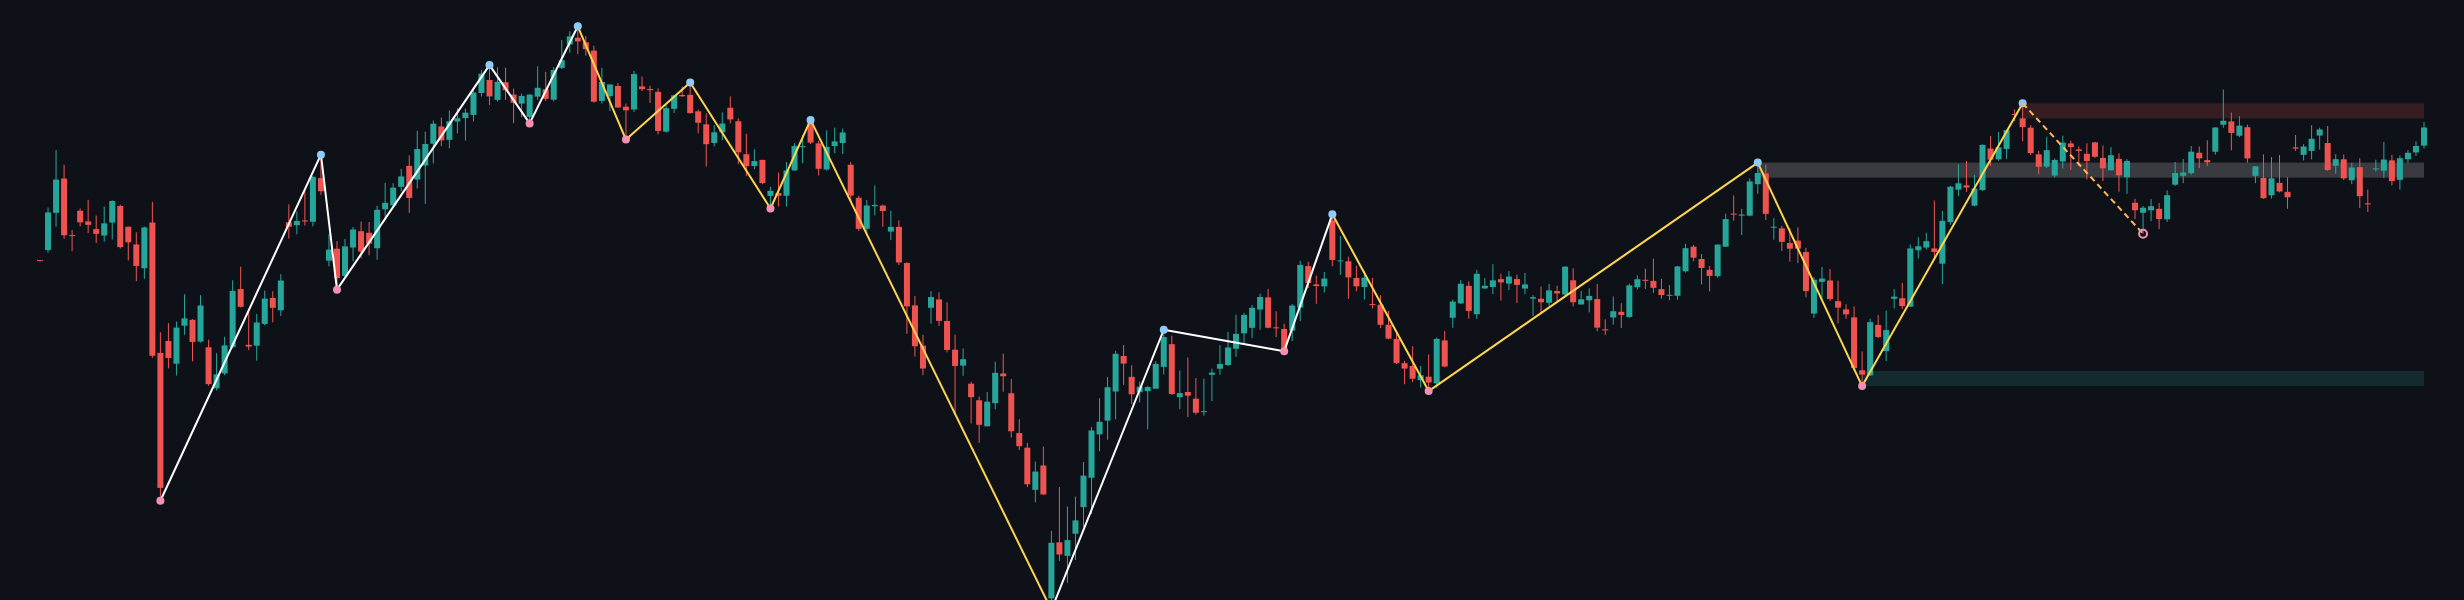
The weekly main trend is up and firm, although the sub-trend is down. This combination describes a strong broader advance that is currently experiencing a countertrend phase rather than a confirmed reversal. The weekly structure event is listed as none, so there is no confirmed weekly break invalidating the broader bullish framework.
The latest weekly close is 1.36441, placing price close to the weekly resistance zone at 1.36985–1.37884. The most recent confirmed weekly swing is a high at 1.37884. A sustained move through that resistance would improve the case for renewed higher-timeframe continuation, while rejection in the zone would keep the weekly sub-trend under pressure.
Below the market, the broken-retest support zone at 1.33446–1.34343 is the first major reference from the weekly structure. The deeper weekly support zone is 1.20993–1.21890. The weekly ATR is 0.01794, indicating that the broader frame allows for materially wider movement than the daily ATR of 0.00555.
The weekly report does not provide numerical EMA readings, so the exact position, spacing and crossover status of those averages is not determinable from the deterministic data. The higher timeframe permits further upside while price remains supported above 1.33446–1.34343, but the resistance band at 1.36985–1.37884 remains the decisive test.
Main-frame structure — Daily
The daily main trend is up and firm, with the sub-trend also up. This aligns with the weekly main trend and suggests that the daily advance is currently reinforcing the broader bullish bias rather than acting as an early reversal signal.
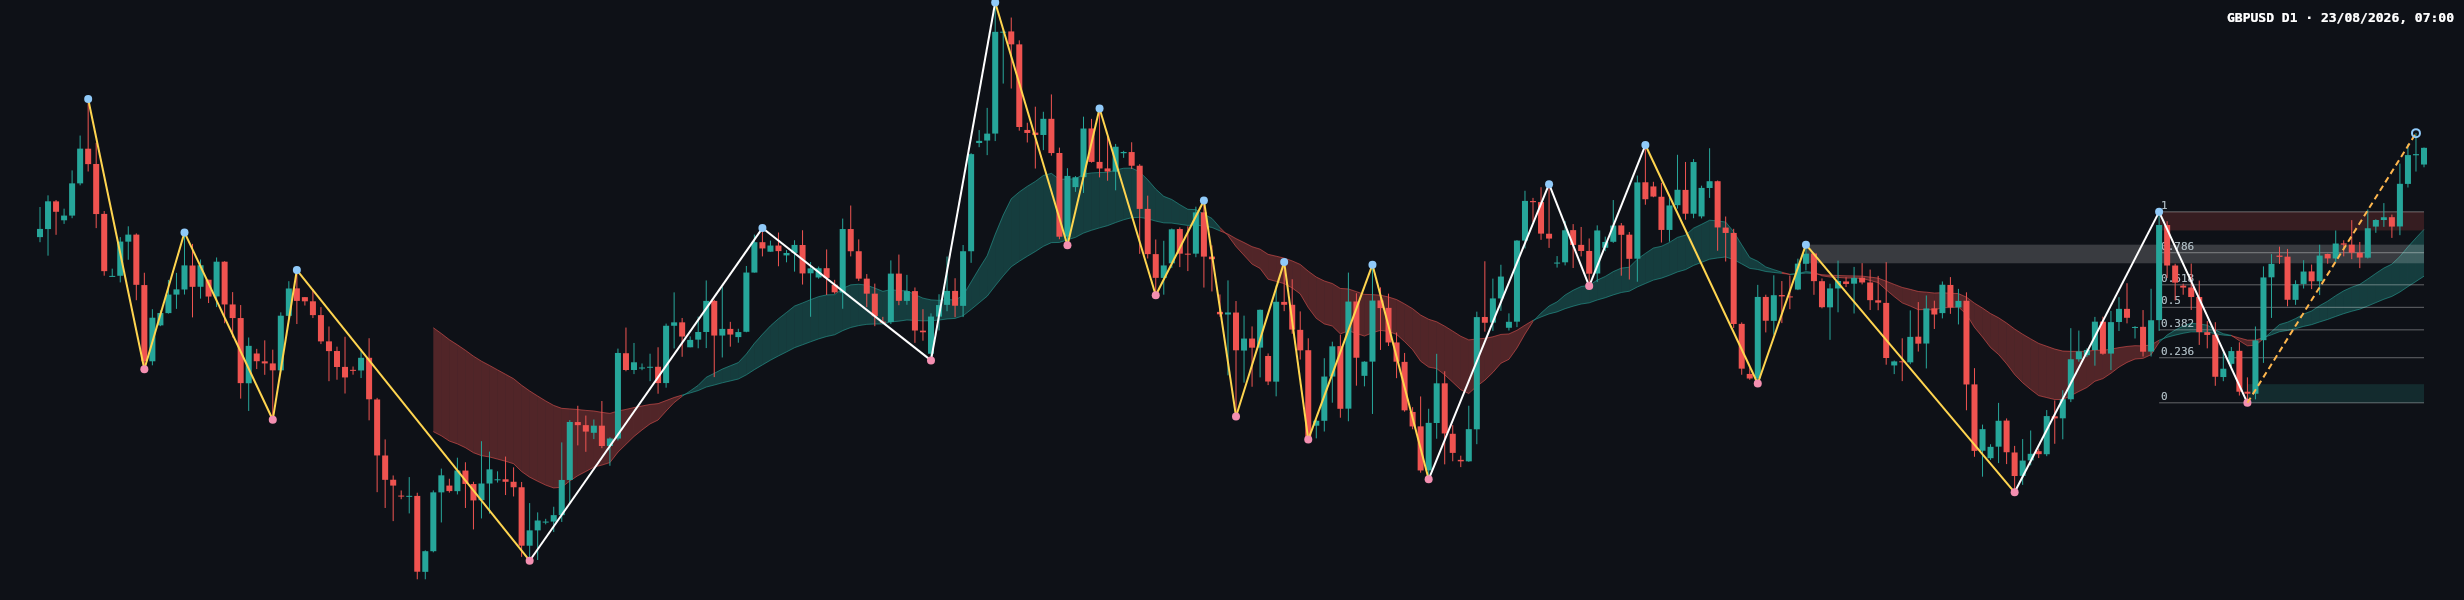
The defining daily structure event is a BOS through 1.35580. The latest confirmed daily swing low is 1.32730. The resistance zone at 1.35303–1.35580 is now best read alongside the broken-retest support zone at 1.34813–1.35090. These levels create a clear distinction between accepted strength above the broken structure and a deeper retracement below it.
The latest completed Dow leg is mapped from Fibonacci 0 at 1.32730 to 1 at 1.35580. Its intermediate levels are 0.236 at 1.33403, 0.382 at 1.33819, 0.5 at 1.34155, 0.618 at 1.34491 and 0.786 at 1.34970. The current retracement ratio is 1.000, placing the completed leg at its upper reference of 1.35580.
The chart shows a recent advance from the daily support area toward the current close of 1.36535. The recent candles appear to be extending upward after consolidation, but the deterministic report does not quantify their individual bodies, wicks or ranges. Accordingly, candle-by-candle classification beyond the visible directional advance is not treated as a confirmed numerical signal.
The chart includes moving-average overlays, but numerical EMA values, volume readings and a quantified momentum measure are not provided in the report. Exact EMA spacing, crossover status and volume confirmation are therefore not determinable from the permitted data.
Key levels and closing-candle read
| Reference | Level or zone | Technical role |
|---|---|---|
| Daily close | 1.36535 | Current main-frame reference |
| Weekly close | 1.36441 | Higher-timeframe reference |
| Weekly resistance | 1.36985–1.37884 | Primary overhead supply area |
| Daily broken level | 1.35580 | Key structure boundary |
| Daily broken-retest support | 1.34813–1.35090 | First downside support reference |
| Daily support | 1.32730–1.33007 | Deeper downside demand area |
| Weekly broken-retest support | 1.33446–1.34343 | Broader structural support |
The latest closing candle is shown within an advancing sequence, but the deterministic report does not identify its formal candle type or provide an exact close location within its range. What can be stated is that the daily close at 1.36535 remains above the broken level at 1.35580 and below the weekly resistance zone at 1.36985–1.37884. That positioning gives the close a constructive interpretation, while leaving the market immediately beneath a significant test.
Scenarios
Primary scenario: continuation toward weekly resistance
If price continues to hold above the daily broken level at 1.35580 and advances into 1.36985–1.37884, the bullish structure remains active. The target zone for this scenario is the weekly resistance band, with 1.37884 also marking the most recent confirmed weekly high. The scenario is weakened if price loses the broken-retest support zone at 1.34813–1.35090.
Secondary scenario: rejection and daily retracement
If price is rejected within 1.36985–1.37884, a pullback toward 1.34813–1.35090 becomes a reasonable technical scenario. That zone would show whether buyers are defending the daily broken structure. A sustained move above 1.37884 would invalidate the rejection-based interpretation.
Risk scenario: loss of daily support
If price breaks below 1.34813–1.35090, the corrective risk increases toward the deeper daily support zone at 1.32730–1.33007. The bearish scenario would be challenged by a recovery above 1.35580, because that would restore the broken-level reference and reduce the immediate significance of the support failure.
What to monitor
- Watch the weekly resistance zone at 1.36985–1.37884 for acceptance, rejection or a failed breakout.
- Monitor 1.35580 as the central daily structure level.
- Observe the broken-retest support at 1.34813–1.35090 and the deeper support at 1.32730–1.33007.
- Within the Fibonacci structure, the levels at 0.786 and 1 correspond to 1.34970 and 1.35580.
- Confirmation of the bullish case would require continued acceptance above 1.35580 followed by meaningful interaction with 1.36985–1.37884. A loss of 1.34813–1.35090 would instead shift attention toward 1.32730–1.33007.
The central bias leans bullish while the daily structure remains above 1.35580, but the market is approaching weekly resistance where two-way volatility and rejection risk may increase.
Summary
- Weekly and daily main trends are both up and firm.
- Daily BOS occurred through 1.35580.
- The current daily close is 1.36535, below weekly resistance at 1.36985–1.37884.
- Daily support is concentrated at 1.34813–1.35090 and 1.32730–1.33007.
- The single most important factor is whether price holds above 1.35580 while testing 1.36985–1.37884.
Tags: #GBPUSD #Forex #PriceAction #DowTheory #TechnicalAnalysis
Meta description: GBPUSD remains bullish above 1.35580, with 1.36985–1.37884 resistance and daily support at 1.34813–1.35090 in focus.
This article is technical analysis and reference information only, not investment advice. Markets carry risk, and readers are responsible for their own decisions.