
GBPUSD is trading with a bullish Daily structure, with the latest closed price at 1.35998 following a confirmed break of 1.35580. The higher-timeframe picture is more cautious: the Weekly main trend remains down, although its sub-trend is up. This creates a market condition in which Daily buyers have control, but the advance is approaching a significant Weekly resistance zone.
Higher-timeframe context: Weekly
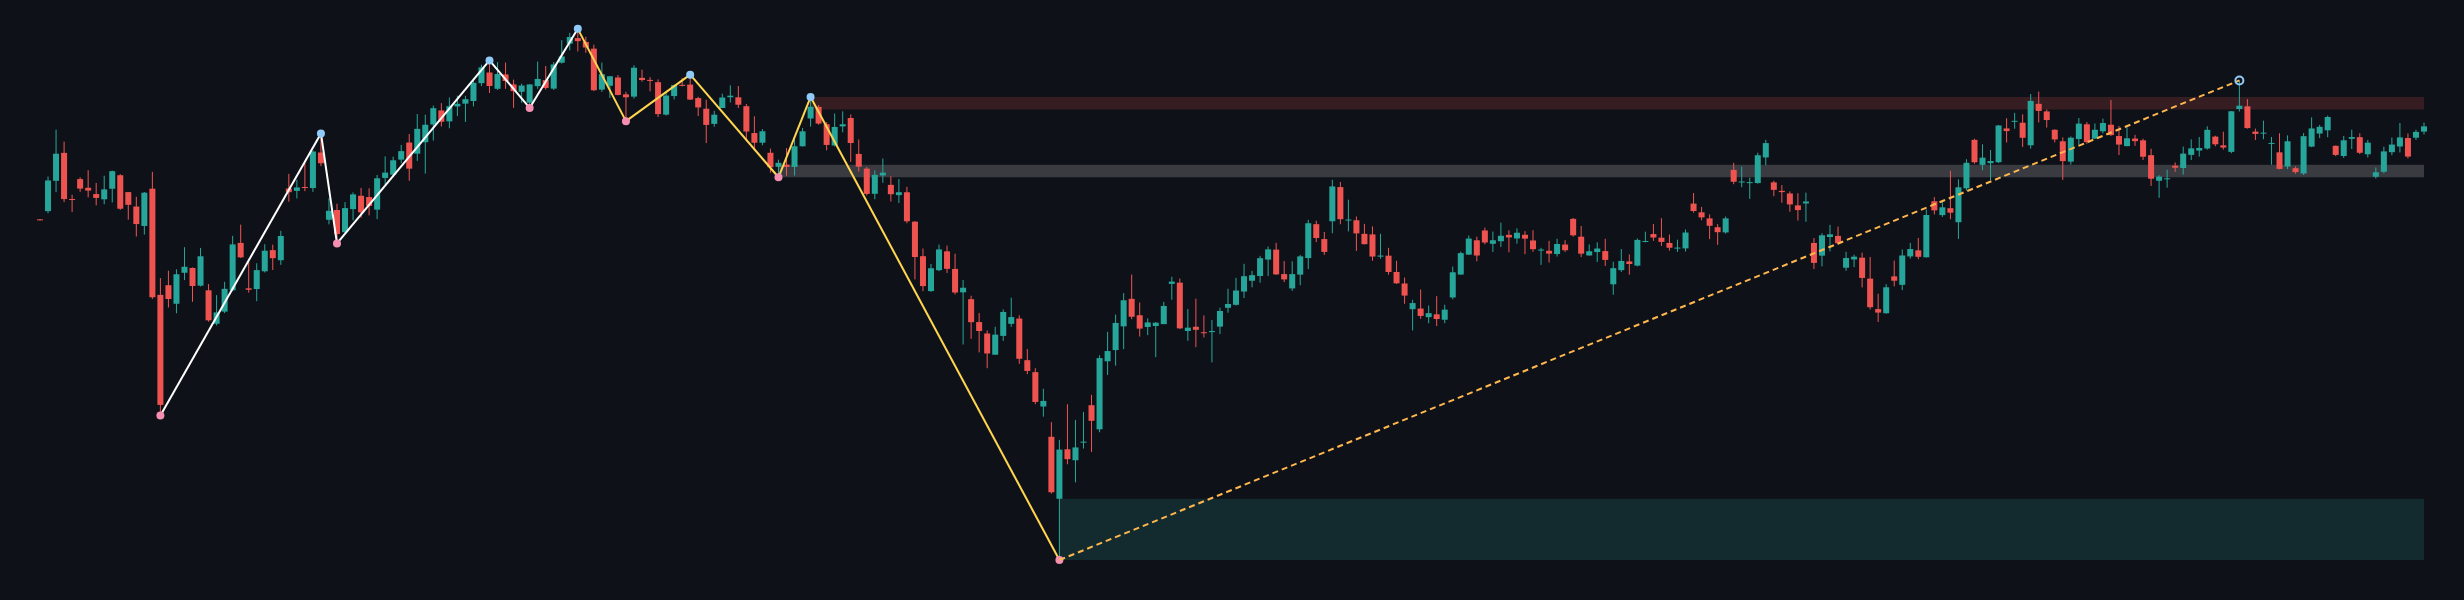
The Weekly chart remains in a firm downtrend, with the most recent confirmed swing marked by a low at 1.03535. No new Weekly structure event is reported. However, the sub-trend is up, showing that the market is currently recovering within the broader bearish framework rather than presenting a confirmed reversal of the main trend.
The nearest Weekly resistance is the zone from 1.36575 to 1.37487. With the last closed Weekly price at 1.35335, this area is directly relevant to the current advance. A sustained move into that zone would test whether the recovery can develop into a larger structural change. The broader Weekly support zone is 1.03535 to 1.08025, while 1.31602 to 1.32514 is a broken-retest resistance zone that may now serve as historical structure beneath the current market.
Weekly indicator values and the exact position of price relative to the moving averages are not determinable from the deterministic report. The Weekly ATR is 0.01825, indicating that the broader timeframe has materially wider price movement than the Daily frame.
The higher-timeframe conclusion is balanced: the Weekly trend still favors caution toward extended upside, but the up sub-trend permits further recovery while price holds above relevant Daily structure.
Main-frame structure: Daily
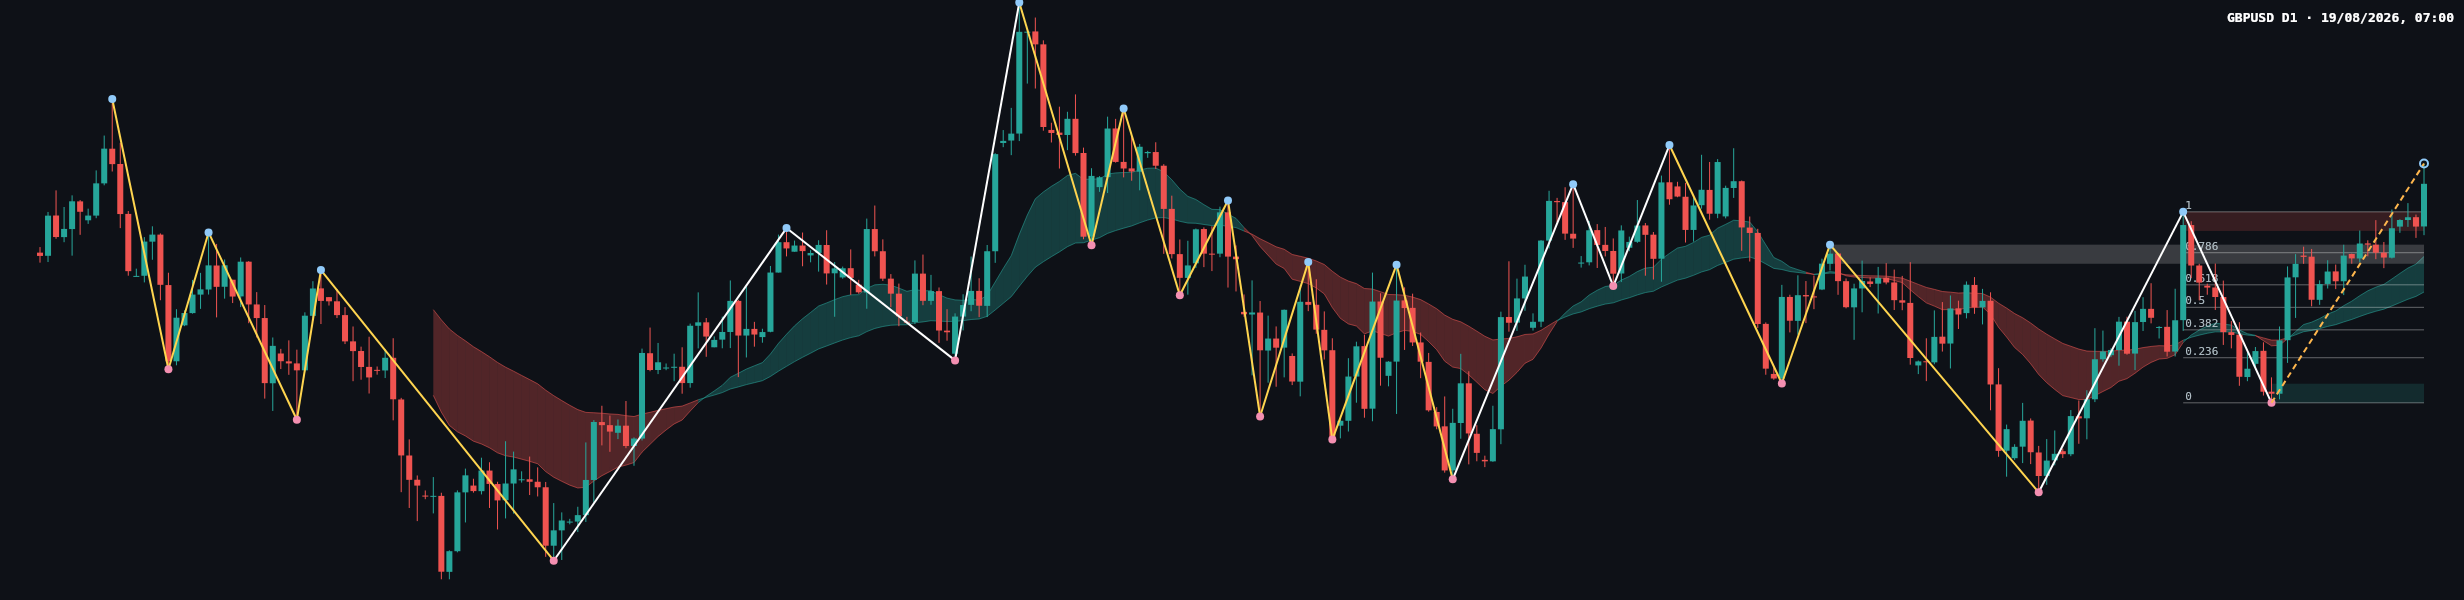
The Daily main trend is firmly up and the sub-trend is also up, aligning with the current Weekly recovery phase. The reported structure event is a bullish break of structure at 1.35580. The latest confirmed Daily swing low is 1.32730, which remains the principal structural reference for the current advance.
The Daily resistance zone is 1.35295 to 1.35580. Since the reported close is 1.35998, price is above that former resistance area. This supports the bullish interpretation, provided the breakout area continues to hold on any retracement. The broken-retest support zone is 1.34805 to 1.35090, while the wider Daily support zone is 1.32730 to 1.33015.
The latest completed Dow leg runs from the Fibonacci level marked 0 at 1.32730 to level 1 at 1.35580. The current retracement ratio is 1.000, meaning the move has reached the upper endpoint of that measured leg. Intermediate references are 0.236 at 1.33403, 0.382 at 1.33819, 0.5 at 1.34155, 0.618 at 1.34491, and 0.786 at 1.34970.
The Daily ATR is 0.00569. Moving-average values, their exact slopes and their spacing are not determinable from the deterministic report, so no specific crossover or compression claim can be made.
Recent price action and closing candle
The most recent candles show a recovery from the latest Daily swing low, followed by a push through the former resistance area. The chart displays alternating bullish and bearish bodies around the recent advance, suggesting that sellers have appeared during pullbacks but have not yet overturned the higher low structure.
The latest closing candle should be interpreted in relation to 1.35580. A close that remains above 1.35580 keeps the breakout structure active and leaves the market exposed to the Weekly resistance zone at 1.36575 to 1.37487. A return beneath 1.35295 would weaken the immediate breakout reading, while a deeper move into 1.34805 to 1.35090 would suggest that the market is testing the broken-retest area rather than extending cleanly.
The precise candle classification, range comparison and close location within the latest candle are not provided numerically in the deterministic report. The chart alone does not establish a reliable volume or momentum reading, so those factors should not be treated as confirmed evidence.
Key levels
| Role | Zone or level | Technical significance |
|---|---|---|
| Current Daily reference | 1.35998 | Latest closed price |
| Weekly resistance | 1.36575–1.37487 | Higher-timeframe supply area above the market |
| Daily broken resistance | 1.35295–1.35580 | Breakout area that may be retested |
| Daily broken-retest support | 1.34805–1.35090 | Deeper support reference beneath the breakout zone |
| Daily structural support | 1.32730–1.33015 | Wider support zone and location of the latest confirmed swing low |
| Weekly broken-retest resistance | 1.31602–1.32514 | Older higher-timeframe structure below current price |
Conditional scenarios
Bullish continuation
If GBPUSD maintains Daily acceptance above 1.35580, the bullish structure remains intact. The next higher-timeframe area to monitor is 1.36575 to 1.37487. This scenario would be weakened by a sustained return below 1.35295, because that would place the breakout area back under pressure.
Bearish retracement
If price falls back through 1.35295 after failing to hold above the broken level at 1.35580, the market may be entering a retest of the Daily breakout structure. The next support area to observe would be 1.34805 to 1.35090. A sustained move below 1.34805 would invalidate the idea that the immediate retracement is being contained by the broken-retest zone.
Broader bearish reversal risk
If selling pressure extends beneath 1.34805 to 1.35090 and then threatens the wider support zone at 1.32730 to 1.33015, the Daily bullish structure would be under substantially greater pressure. A move below 1.32730 would invalidate the current Daily higher-low framework and shift attention back toward the broader Weekly downtrend.
Estimated scenario probabilities are not provided by the deterministic report and therefore cannot be stated as percentages. The directional bias currently leans bullish on the Daily frame, but the Weekly resistance zone makes continuation conditional rather than automatic.
What to monitor
- Whether Daily closes remain above 1.35580.
- Whether the former resistance zone at 1.35295 to 1.35580 behaves as support during a pullback.
- Whether price reaches and rejects the Weekly resistance zone at 1.36575 to 1.37487.
- Whether a deeper retracement holds inside 1.34805 to 1.35090.
- Whether the Daily structure remains above the swing low at 1.32730.
The cleanest confirmation of the bullish case would be continued acceptance above 1.35580 followed by an orderly response around the Weekly resistance zone. The bearish case would gain credibility from a failure below 1.35295, followed by weakness through 1.34805 to 1.35090.
Summary
- GBPUSD has a firm bullish Daily trend after a reported break of 1.35580.
- The Weekly main trend remains down, although its sub-trend is up.
- 1.35295 to 1.35580 is the central breakout and retest area.
- The main higher-timeframe upside test is 1.36575 to 1.37487.
- A deeper Daily deterioration would first bring 1.34805 to 1.35090 into focus, followed by 1.32730 to 1.33015.
The single most important issue is whether price can hold above 1.35580 while approaching the Weekly resistance zone.
#GBPUSD #ForexAnalysis #TechnicalAnalysis #PriceAction #DowTheory
Meta description: GBPUSD Daily analysis: buyers hold above 1.35580 while Weekly resistance at 1.36575–1.37487 defines the next key test.
This article is technical analysis and reference information only, not investment advice. Markets carry risk, and readers are responsible for their own decisions.