
GBPUSD is trading at 1.35458, directly within the daily resistance zone at 1.35300–1.35580. The daily structure remains sideways, while the weekly trend is still firmly down despite an upward sub-trend. The most important question is whether price can establish itself above 1.35580 or instead reject the zone and rotate toward 1.34810–1.35090.
Higher-timeframe context
The weekly chart maintains a firm downtrend, with the most recent confirmed swing marked at a low of 1.03535. The upward sub-trend has carried price away from the broad weekly support zone at 1.03535–1.08025, but no weekly structure event has been confirmed. This means the recovery has not yet changed the primary directional framework.
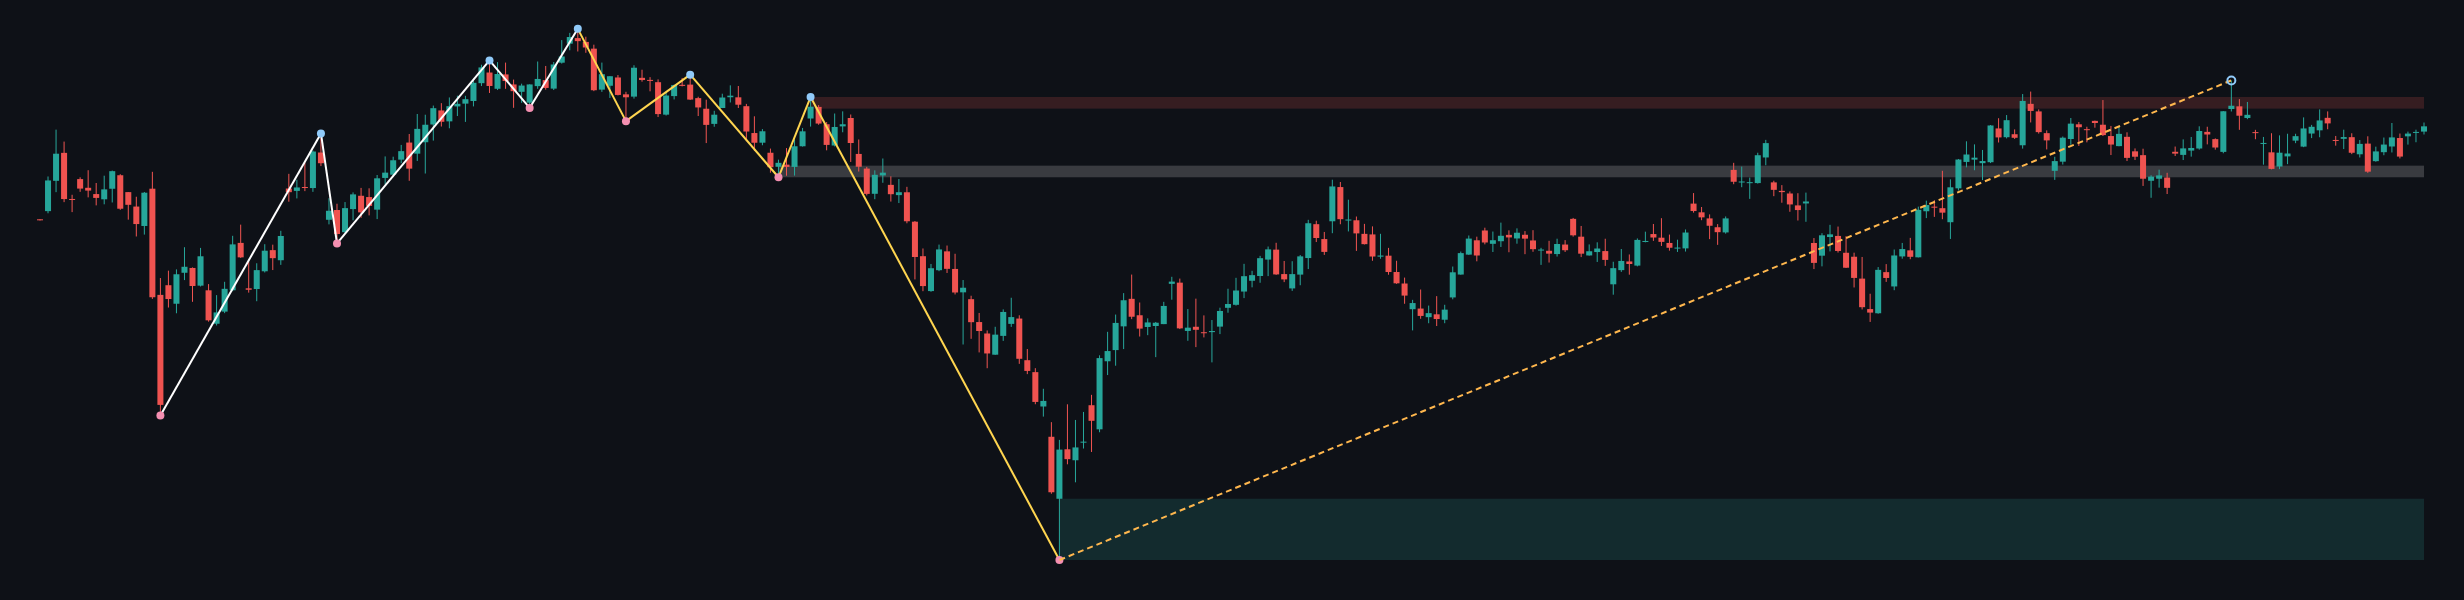
Price is approaching the weekly resistance zone at 1.36637–1.37487. That area is materially above the current weekly close of 1.35335 and represents the next major supply region if the daily market can sustain its recovery. Below price, the weekly broken-retest resistance zone at 1.31602–1.32452 remains an important structural reference. A sustained move back toward that zone would suggest that the broader bearish trend is regaining control.
The weekly ATR is 0.01699, indicating a relatively wide higher-timeframe range compared with the local daily structure. No weekly structure break is reported. The higher timeframe therefore permits further upside toward 1.36637–1.37487, but it continues to favor caution around resistance because the main trend remains down.
Main-frame structure
On the daily chart, the main trend and sub-trend are both sideways. The last closed price is 1.35458, while the most recent confirmed swing is a high at 1.35580. Price is therefore pressing against the upper boundary of the active daily range rather than moving through an established directional trend.
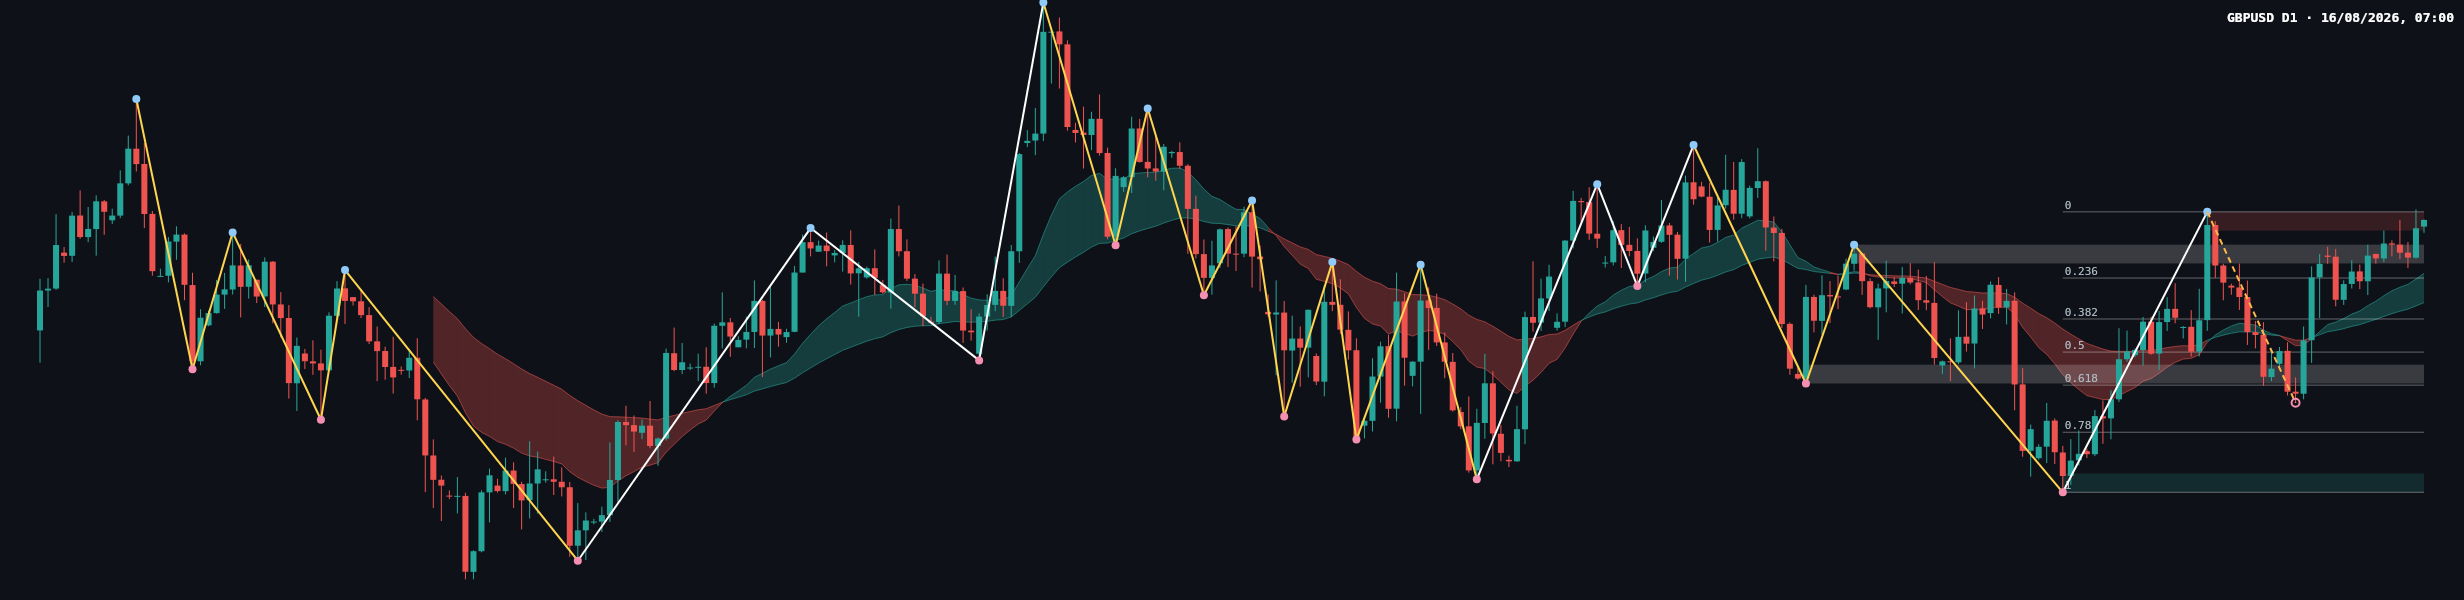
The nearest daily resistance is 1.35300–1.35580. The nearest support is the broken-retest zone at 1.34810–1.35090, followed by the broader support zone at 1.31395–1.31675. The daily ATR is 0.00560, so movement around the resistance band may remain uneven and subject to reversals while the market is classified as sideways.
The latest completed Dow leg runs from 1.35580 to 1.31395. Its Fibonacci references are 0: 1.35580, 0.236: 1.34592, 0.382: 1.33981, 0.5: 1.33487, 0.618: 1.32994, 0.786: 1.32291 and 1: 1.31395. The current retracement ratio is 0.029, placing the market close to the 0 reference at 1.35580. This makes the current resistance test more important than the mid-leg Fibonacci levels at present.
No daily structure event is reported. The chart shows a recovery from the lower support area followed by consolidation beneath the recent swing high. That behavior is consistent with a range condition, not a confirmed reversal.
Key levels and the latest candle
| Reference | Zone or level | Role |
|---|---|---|
| Daily resistance | 1.35300–1.35580 | Current test and latest confirmed swing high |
| Daily broken-retest support | 1.34810–1.35090 | First downside reaction area |
| Daily support | 1.31395–1.31675 | Deeper structural support |
| Weekly resistance | 1.36637–1.37487 | Higher-timeframe supply above the daily range |
| Weekly broken-retest resistance | 1.31602–1.32452 | Broader structural reference below price |
The most recent daily candles appear relatively compressed near the upper part of the range, with alternating direction and limited follow-through. The latest close at 1.35458 sits inside 1.35300–1.35580 and below the confirmed swing high at 1.35580. This is not a clear continuation signal: buyers have brought price to resistance, but the chart does not yet show decisive acceptance above it.
Relative to the Fibonacci structure, the close remains near the 0 reference at 1.35580, while the 0.236 level at 1.34592 is below the current support band. A rejection from 1.35300–1.35580 would therefore leave 1.34810–1.35090 as the first area where buyers would need to demonstrate renewed demand. A failure of that support would expose the lower daily support at 1.31395–1.31675.
Volume and a conventional momentum reading are not provided in the deterministic report, so confirmation from those measures is not determinable here. The visible price action instead points to indecision and balance near resistance.
Conditional scenarios
Primary scenario: range rejection
- Trigger condition: Price fails to hold above 1.35300–1.35580 and turns lower within or below that resistance zone.
- Target zone: The first area to observe is the broken-retest support at 1.34810–1.35090.
- Invalidation: A sustained daily acceptance above 1.35580 would weaken the rejection scenario.
- Estimated probability: Highest relative probability, although an exact percentage is not determinable from the report.
This is the cautious base case because the daily trend is sideways, the latest confirmed swing is 1.35580, and the weekly primary trend remains down. It describes a possible rotation inside the range rather than a directional call.
Secondary scenario: bullish continuation
- Trigger condition: A daily close above 1.35580, followed by evidence that 1.35300–1.35580 is being accepted rather than rejected.
- Target zone: The next higher-timeframe resistance area is 1.36637–1.37487.
- Invalidation: A return below 1.35300 after the breakout would question the continuation signal.
- Estimated probability: Lower than the primary scenario while the weekly main trend remains down; an exact percentage is not determinable from the report.
A break above 1.35580 would improve the daily structure, but it would still occur beneath weekly resistance at 1.36637–1.37487. The higher-timeframe downtrend would therefore remain a relevant constraint until a larger structural change is confirmed.
Risk scenario: support failure
- Trigger condition: Price loses 1.34810–1.35090 and fails to recover that broken-retest zone.
- Target zone: The deeper daily support zone at 1.31395–1.31675 becomes the next major area to monitor.
- Invalidation: A recovery back above 1.35090 would reduce the immediate significance of the support failure.
- Estimated probability: Conditional and lower in the immediate range while support remains intact; an exact percentage is not determinable from the report.
Key considerations
- Resistance: Monitor 1.35300–1.35580 first, then 1.36637–1.37487 on a confirmed daily continuation.
- Support: The first downside reference is 1.34810–1.35090, with 1.31395–1.31675 as deeper support.
- Fibonacci: The market is close to 0: 1.35580, while 0.236: 1.34592 and 0.382: 1.33981 are lower retracement references.
- Confirmation: The bullish case requires acceptance above 1.35580. The bearish range case requires rejection from 1.35300–1.35580, while the deeper bearish case requires a loss of 1.34810–1.35090.
- Traps: A brief move above 1.35580 that closes back inside 1.35300–1.35580 would represent a possible false breakout. Conversely, a brief move below 1.34810 that quickly recovers could represent a liquidity sweep rather than a confirmed breakdown.
- Fundamentals: No news or economic-calendar context is supplied in the report. DXY, US yields, scheduled data and central-bank communication should be considered separately because their timing and impact are not determinable here.
- Risk control: Any market decision should account for the daily ATR of 0.00560 and the weekly ATR of 0.01699. Avoid treating a single candle or intraday spike as confirmation of a structural change.
Session-specific behavior is not provided for this GBPUSD report. The practical focus should remain on whether the daily close is accepted above 1.35580, rejected from 1.35300–1.35580, or carried back below 1.34810–1.35090.
Summary
- GBPUSD closed at 1.35458, inside the daily resistance zone at 1.35300–1.35580.
- The weekly main trend remains firmly down, although the sub-trend is up.
- The daily market is sideways, with no confirmed structure event.
- A sustained move above 1.35580 would expose weekly resistance at 1.36637–1.37487.
- A rejection could return attention to 1.34810–1.35090, while a loss of that zone would increase the importance of 1.31395–1.31675.
The single most important thing today is whether price can establish acceptance above 1.35580 or is rejected back below the 1.35300–1.35580 resistance zone.
GBPUSD analysis · Price action · Dow Theory · Multi-timeframe analysis · Technical analysis
This article is technical analysis and reference information only, not investment advice. Markets carry risk, and readers are responsible for their own decisions.