GBPUSD is trading at 1.34885 on the main chart, close to the broken-retest support zone at 1.34775–1.35090. The daily structure remains sideways with a down sub-trend, while the weekly chart shows a firm downtrend alongside an upward sub-trend. This leaves the market balanced between nearby support and the daily resistance zone at 1.35265–1.35580.

Higher-timeframe context

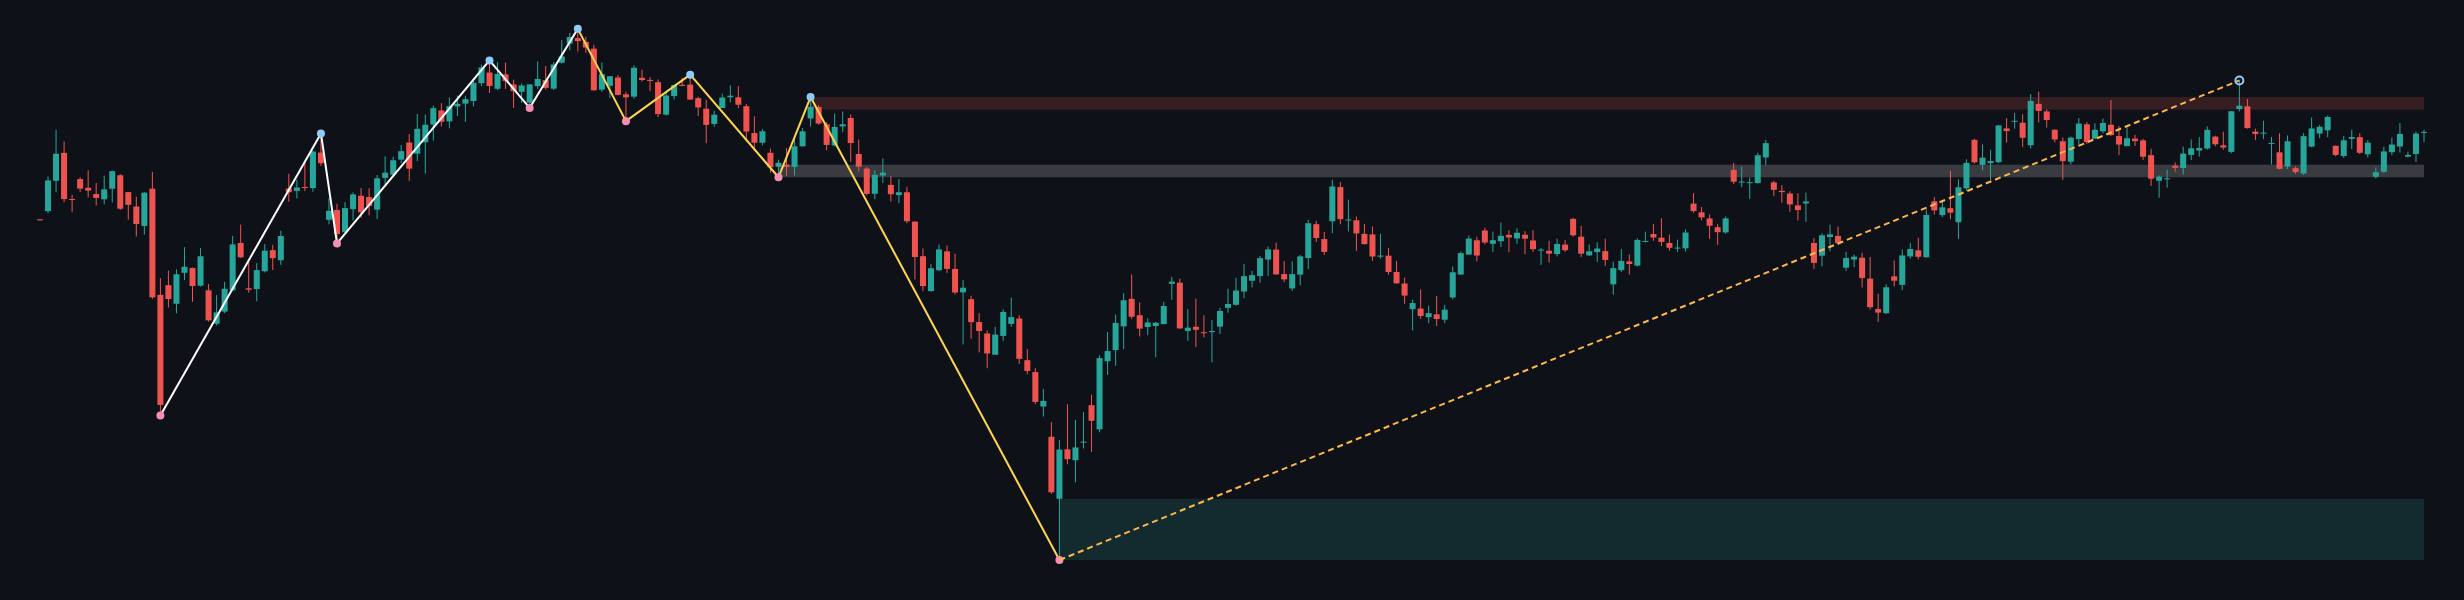
The weekly trend is firmly down, although the sub-trend is up. The most recent confirmed weekly swing is a low at 1.03535, and no weekly structure event is reported. Price is therefore recovering within a broader bearish framework rather than confirming a new long-term uptrend.

The weekly chart shows a broken-retest resistance zone at 1.31602–1.32521. Above the current market, the more significant resistance area is 1.36568–1.37487. The larger weekly support zone is 1.03535–1.08025. Weekly ATR is 0.01838, indicating a wider higher-timeframe volatility envelope than the daily ATR of 0.00629.

The broader message is conditional: the weekly recovery can continue while price holds above nearby daily support, but the firm weekly downtrend keeps rallies vulnerable beneath 1.36568–1.37487.

GBPUSD W1 context chart

Main-frame structure

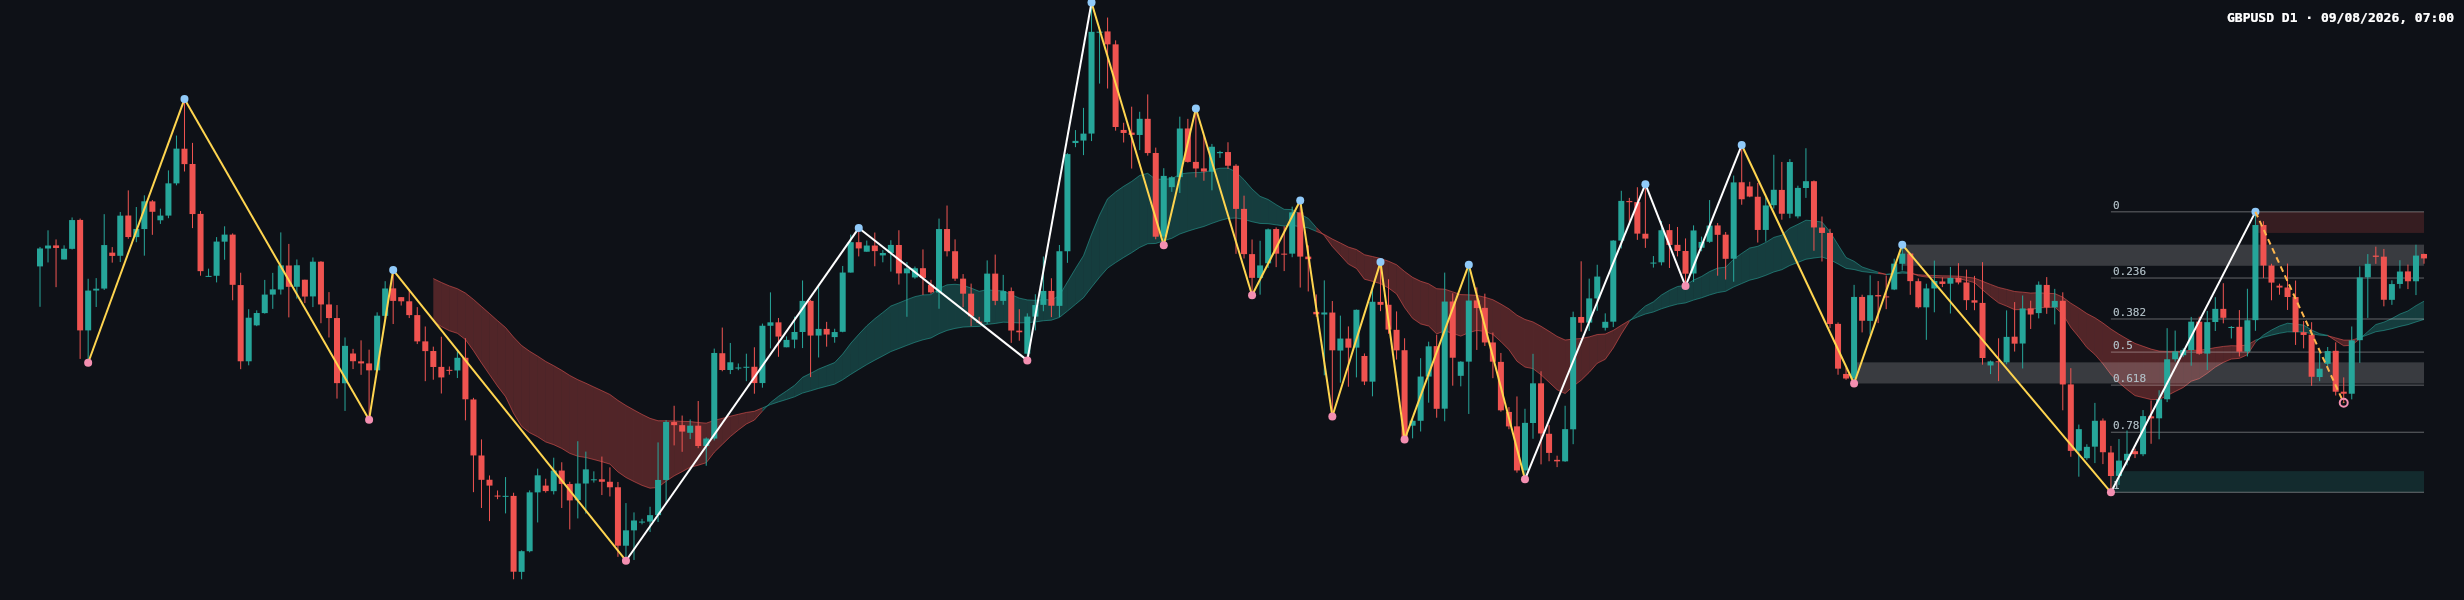
On the daily chart, the main trend is sideways and firm, with a down sub-trend. This is not fully aligned with the weekly picture: the daily market is consolidating inside a broader weekly recovery, while its shorter directional movement is weakening.

The most recent confirmed daily swing is a high at 1.35580. No daily structure event is reported. The immediate structural boundary is therefore the resistance zone at 1.35265–1.35580, while the market is currently testing the broken-retest support zone at 1.34775–1.35090.

The moving-average values and their exact spacing are not included in the deterministic report, so their numerical position, slope, crossover status and compression are not determinable here. The chart does show the moving-average ribbon, but the analysis should give priority to the reported price zones and confirmed swing.

GBPUSD D1 chart
GBPUSD D1 chart

Key levels and Fibonacci context

AreaReported levelRole
Daily resistance1.35265–1.35580Upper boundary of the current daily range
Daily broken-retest support1.34775–1.35090Immediate test beneath the latest close
Daily support1.31395–1.31710Lower structural support
Daily broken-retest resistance1.33019–1.33334Potential reaction area below the current range
Weekly resistance1.36568–1.37487Higher-timeframe supply area

The latest completed daily Dow leg runs from 1.35580 to 1.31395. Its Fibonacci levels are: 0.236 at 1.34592, 0.382 at 1.33981, 0.5 at 1.33487, 0.618 at 1.32994, and 0.786 at 1.32291. The current retracement ratio is 0.166, placing the market near the shallow-retracement part of that leg rather than near the deeper Fibonacci areas.

Recent candle and price action reading

The latest candle appears relatively narrow-bodied compared with the more pronounced swings visible earlier on the chart. Its close is near the current consolidation area, around the broken-retest support zone at 1.34775–1.35090, rather than at a decisive breakout point.

Because the deterministic report does not classify the candle or provide its exact open, high and low, a formal label such as a pin bar, engulfing candle or doji is not determinable. The visible price action nevertheless suggests hesitation: sellers have not established a clean continuation below 1.34775–1.35090, while buyers have not yet reclaimed 1.35265–1.35580.

Relative to the recent daily swings, this is better treated as a range candle and a warning of indecision than as confirmed reversal evidence. A decisive close beyond either surrounding zone would carry more structural information than the latest candle alone.

Conditional scenarios

Primary scenario: continued daily consolidation

  • Trigger: price continues to hold the broken-retest support area at 1.34775–1.35090 without closing above the daily resistance zone.
  • Potential path: rotation within the space between 1.34775–1.35090 and 1.35265–1.35580.
  • Invalidation: a sustained close outside this range, particularly above 1.35265–1.35580 or below 1.34775–1.35090.
  • Probability: not numerically assigned because the deterministic report provides no probability estimates.

Secondary scenario: bullish range escape

  • Trigger: a clear daily close above 1.35265–1.35580, followed by acceptance above that zone.
  • Potential path: the next higher-timeframe resistance area is 1.36568–1.37487.
  • Invalidation: a return below 1.34775–1.35090 after the attempted reclaim.
  • Probability: not numerically assigned in the report.

Risk scenario: bearish break

  • Trigger: a daily close below 1.34775–1.35090 that is not quickly recovered.
  • Potential path: the Fibonacci areas at 1.34592, 1.33981, 1.33487 and 1.32994 become relevant reaction points, with the broader daily support zone at 1.31395–1.31710 below.
  • Invalidation: a reclaim of 1.35265–1.35580.
  • Probability: not numerically assigned in the report.

Overall, the daily bias leans range-to-bearish while price remains below 1.35265–1.35580; the expected trading area is bounded first by 1.34775–1.35090 and 1.35265–1.35580, subject to a confirmed break.

Closing view

  • The weekly trend remains firmly down, despite an upward sub-trend.
  • The daily chart is sideways with a down sub-trend and no reported structure event.
  • 1.34775–1.35090 is the immediate support test.
  • 1.35265–1.35580 is the key daily resistance boundary.
  • A move beyond the range would determine whether the next path points toward 1.36568–1.37487 or the lower Fibonacci and support areas.

The single most important thing today is whether GBPUSD can hold 1.34775–1.35090 while remaining below 1.35265–1.35580, or instead produces a confirmed close outside that range.

This article is technical analysis and reference information only, not investment advice. Markets carry risk, and readers are responsible for their own decisions.

#GBPUSD #Forex #PriceAction #DowTheory #TechnicalAnalysis

GBPUSD analysis: daily range between 1.34775–1.35090 support and 1.35265–1.35580 resistance, with weekly trend context and conditional scenarios.