
GBPUSD is consolidating on the daily timeframe after recovering from the lower support area. The last closed price is 1.34927, placing the market inside the daily broken-retest support zone at 1.34757 – 1.35090 and below nearby resistance at 1.35247 – 1.35580. The broader weekly trend remains firmly down, although the weekly sub-trend is up.
| Metric | Reading |
|---|---|
| Last closed price | 1.34927 |
| Weekly trend | Down, with an upward sub-trend |
| Daily trend | Sideways, with a downward sub-trend |
| Nearest resistance | 1.35247 – 1.35580 |
| Nearest support | 1.34757 – 1.35090 |
| Deeper support | 1.31395 – 1.31728 |
| Current Fibonacci retracement | 0.156 |
| Daily ATR | 0.00666 |
Higher-timeframe context
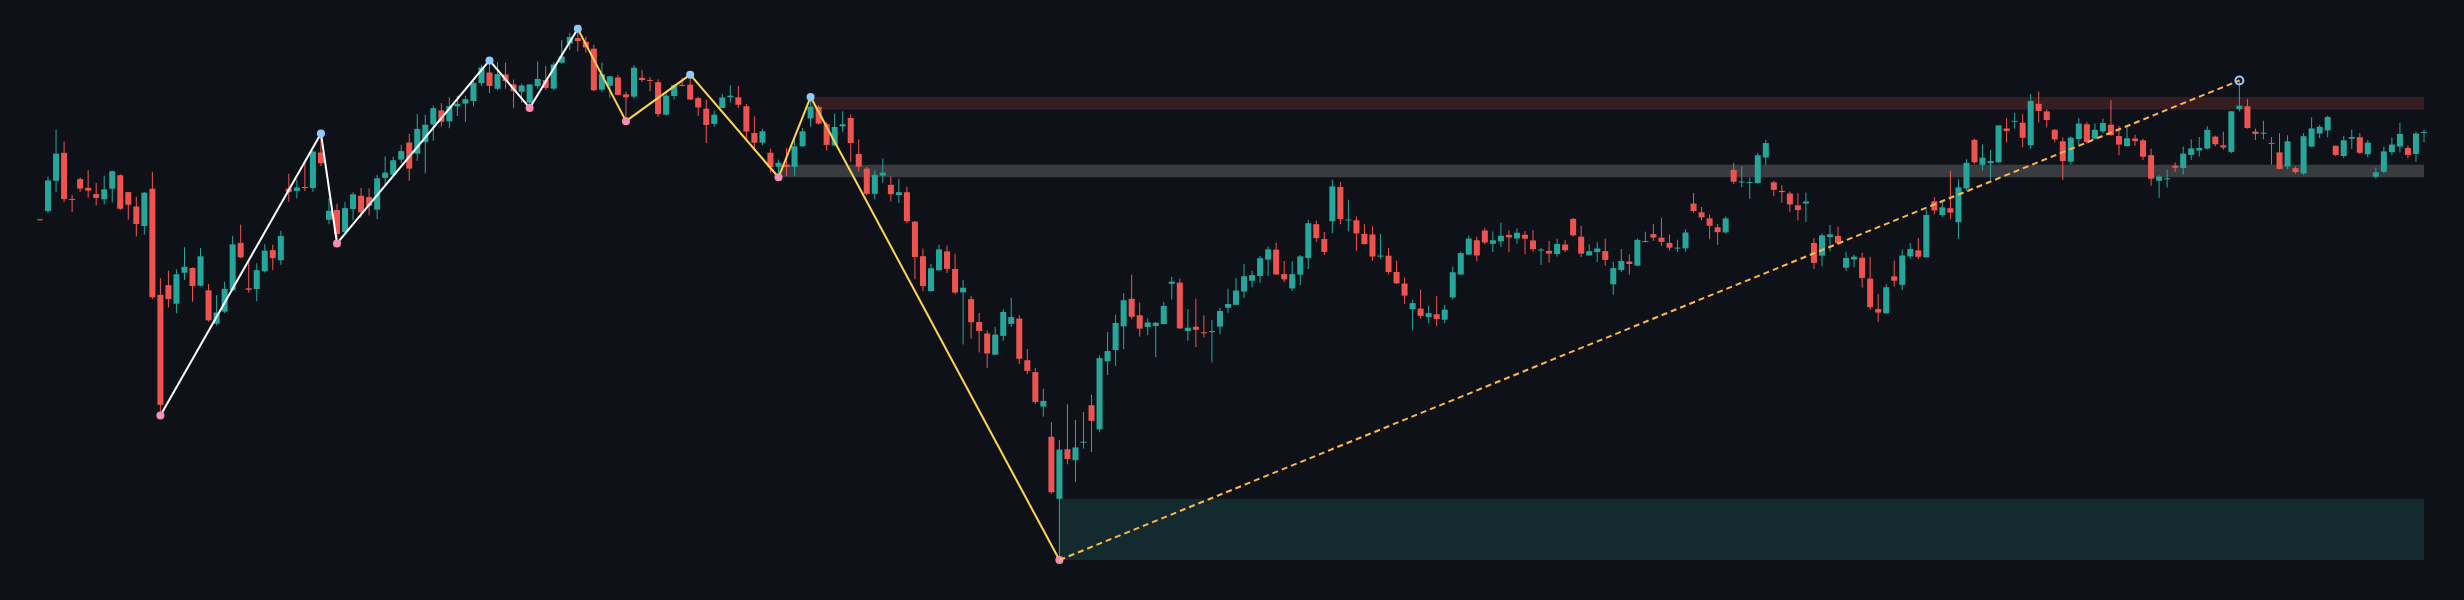
The weekly chart retains a firm downtrend, while the sub-trend is up. The most recent confirmed weekly swing is a low at 1.03535, and the report identifies no current structure event. This combination describes a recovery within a larger bearish framework rather than a confirmed change in the primary trend.
Weekly resistance is located at 1.36566 – 1.37487. The broken-retest resistance zone at 1.31602 – 1.32523 is below the current market and can be treated as an important structural reference. The broader weekly support zone is 1.03535 – 1.08025. The weekly ATR is 0.01843, indicating a materially wider higher-timeframe range than the daily ATR.
Price is therefore positioned between the daily resistance at 1.35247 – 1.35580 and the larger weekly resistance at 1.36566 – 1.37487. A sustained move through the daily ceiling would improve the case for a continuation of the weekly sub-trend, but it would not by itself remove the firm weekly downtrend.
Main-frame structure
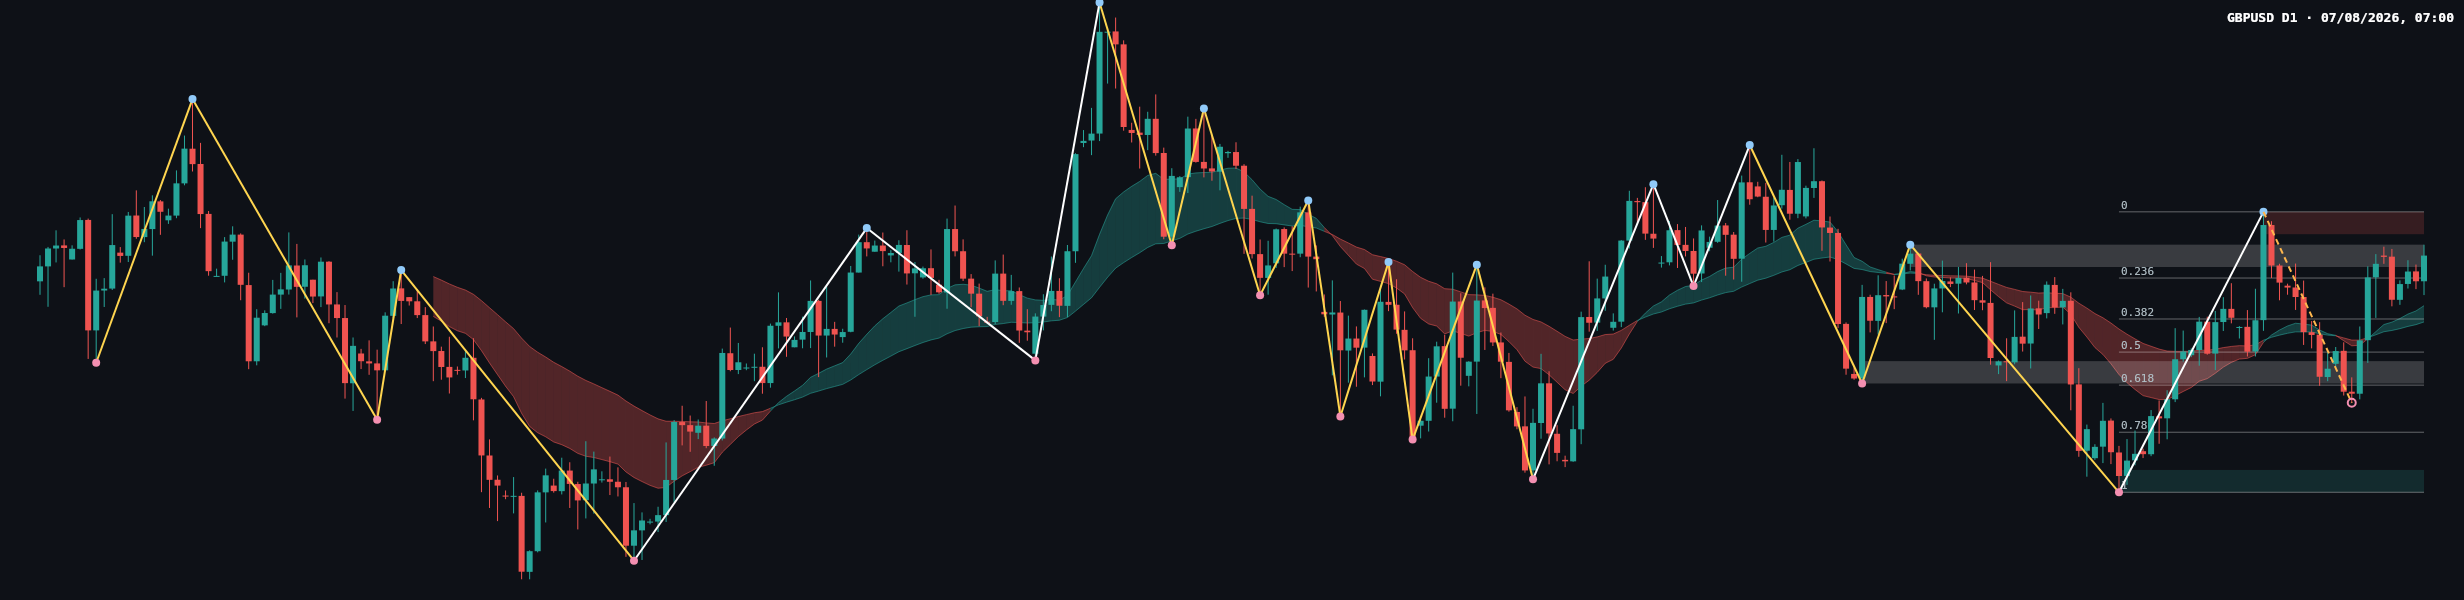
The daily trend is sideways and the daily sub-trend is down, so the lower timeframe is not fully aligned with the weekly recovery. The latest confirmed daily swing is a high at 1.35580, and no daily structure event is reported. The market is consequently still operating inside a range rather than presenting a confirmed bullish or bearish break.
Daily support is marked at 1.31395 – 1.31728, while the nearest resistance is 1.35247 – 1.35580. The zone at 1.34757 – 1.35090 is a broken-retest support area and currently contains the last closed price at 1.34927. This makes the zone especially important for judging whether the latest consolidation is absorption by buyers or a pause before renewed selling.
The latest completed Dow leg has Fibonacci levels at 0: 1.35580, 0.236: 1.34592, 0.382: 1.33981, 0.5: 1.33487, 0.618: 1.32994, 0.786: 1.32291, and 1: 1.31395. The current retracement ratio is 0.156, placing the market close to the upper portion of that completed leg and below the swing high at 1.35580.
The chart shows alternating advances and declines around the moving-average cloud, consistent with the reported sideways structure. Exact EMA values, slopes, spacing, and any crossover are not determinable from the deterministic report. Volume and momentum readings are also not supplied, so they should not be treated as confirmation.
Key levels
- 1.35247 – 1.35580: nearest daily resistance and the area containing the most recent confirmed swing high.
- 1.34757 – 1.35090: daily broken-retest support containing the last closed price.
- 1.34592: the daily Fibonacci 0.236 level below the current support area.
- 1.33019 – 1.33352: broken-retest resistance that may become relevant if price moves into the deeper Fibonacci region.
- 1.31395 – 1.31728: deeper daily support and the lower endpoint of the latest completed Fibonacci leg.
- 1.36566 – 1.37487: major weekly resistance above the daily ceiling.
Conditional scenarios
Bullish scenario
If price establishes a daily close above 1.35580, the sideways range would be challenged on the upside. Follow-through could expose the weekly resistance zone at 1.36566 – 1.37487. This scenario would lose force if price returns below 1.35247 after the attempted break, because that would indicate rejection from the daily resistance band.
Bearish scenario
If price breaks and sustains below 1.34757, sellers would regain control of the broken-retest area. The first Fibonacci reference below is 1.34592, followed by 1.33981, 1.33487, and the broader support zone at 1.31395 – 1.31728. The bearish scenario would be weakened by a recovery above 1.35090.
Range scenario
Price may continue rotating between the support area at 1.34757 – 1.35090 and resistance at 1.35247 – 1.35580. Repeated rejection at both boundaries would preserve the daily sideways classification. A sustained close outside either boundary would invalidate the range interpretation and make directional follow-through more important.
Session focus
The clearest information would come from how price behaves at the two nearest daily zones. Acceptance above 1.35580 would favor the bullish continuation path, while acceptance below 1.34757 would favor a move toward the lower Fibonacci references. A brief intraday breach followed by a close back inside the zone would instead warn of a false breakout.
The broader weekly downtrend remains the main risk to an upside continuation. Conversely, the weekly upward sub-trend and the current position within daily support are the main reasons not to assume that every decline will extend immediately. The economic calendar, central-bank communication, currency-market sentiment, and changes in broader risk appetite can all increase volatility around these technical boundaries.
Summary
- GBPUSD closed at 1.34927, inside the daily broken-retest support zone at 1.34757 – 1.35090.
- The daily structure is sideways with a downward sub-trend, while the weekly trend is firmly down with an upward sub-trend.
- A confirmed move above 1.35580 would expose the weekly resistance zone at 1.36566 – 1.37487.
- A sustained move below 1.34757 would refocus attention on 1.34592 and the deeper daily support at 1.31395 – 1.31728.
The single most important point is whether price is accepted above 1.35580 or below 1.34757, since the market remains trapped between those boundaries.
GBPUSD technical analysis: daily consolidation, weekly downtrend, key support at 1.34757 – 1.35090, and resistance at 1.35247 – 1.35580.
#GBPUSD #Forex #PriceAction #DowTheory #TechnicalAnalysis
This article is technical analysis and reference information only, not investment advice. Markets carry risk, and readers are responsible for their own decisions.