
GBPUSD is trading at 1.34689 on the daily frame, where a sideways structure is accompanied by a downward sub-trend. The higher-timeframe picture remains a firm downtrend with an upward sub-trend, so the current area is a decision zone rather than a confirmed directional breakout. The most notable feature is the close beneath the daily broken-retest support zone at 1.34749–1.35090, while the current retracement ratio of 0.213 is close to the 0.236 Fibonacci level at 1.34592.
Higher-timeframe context
The weekly chart describes a firm downtrend, although the sub-trend is up. There has been no reported structure event, and the most recent confirmed swing is a low at 1.09232. This combination allows for continued corrective strength, but it does not yet establish a change in the broader directional framework.
The main weekly resistance zone is 1.36587–1.37487. A lower resistance area at 1.31717–1.32617 is marked as a broken-retest zone. The broad weekly support zone is 1.09232–1.10850. With the last closed weekly price at 1.34804, price is positioned below the higher resistance zone and above the broad support area. The weekly ATR is 0.01801.
Weekly EMA positions and their exact values are not determinable from the deterministic report. The chart therefore supports a price-action and zone-based reading rather than a precise moving-average comparison.
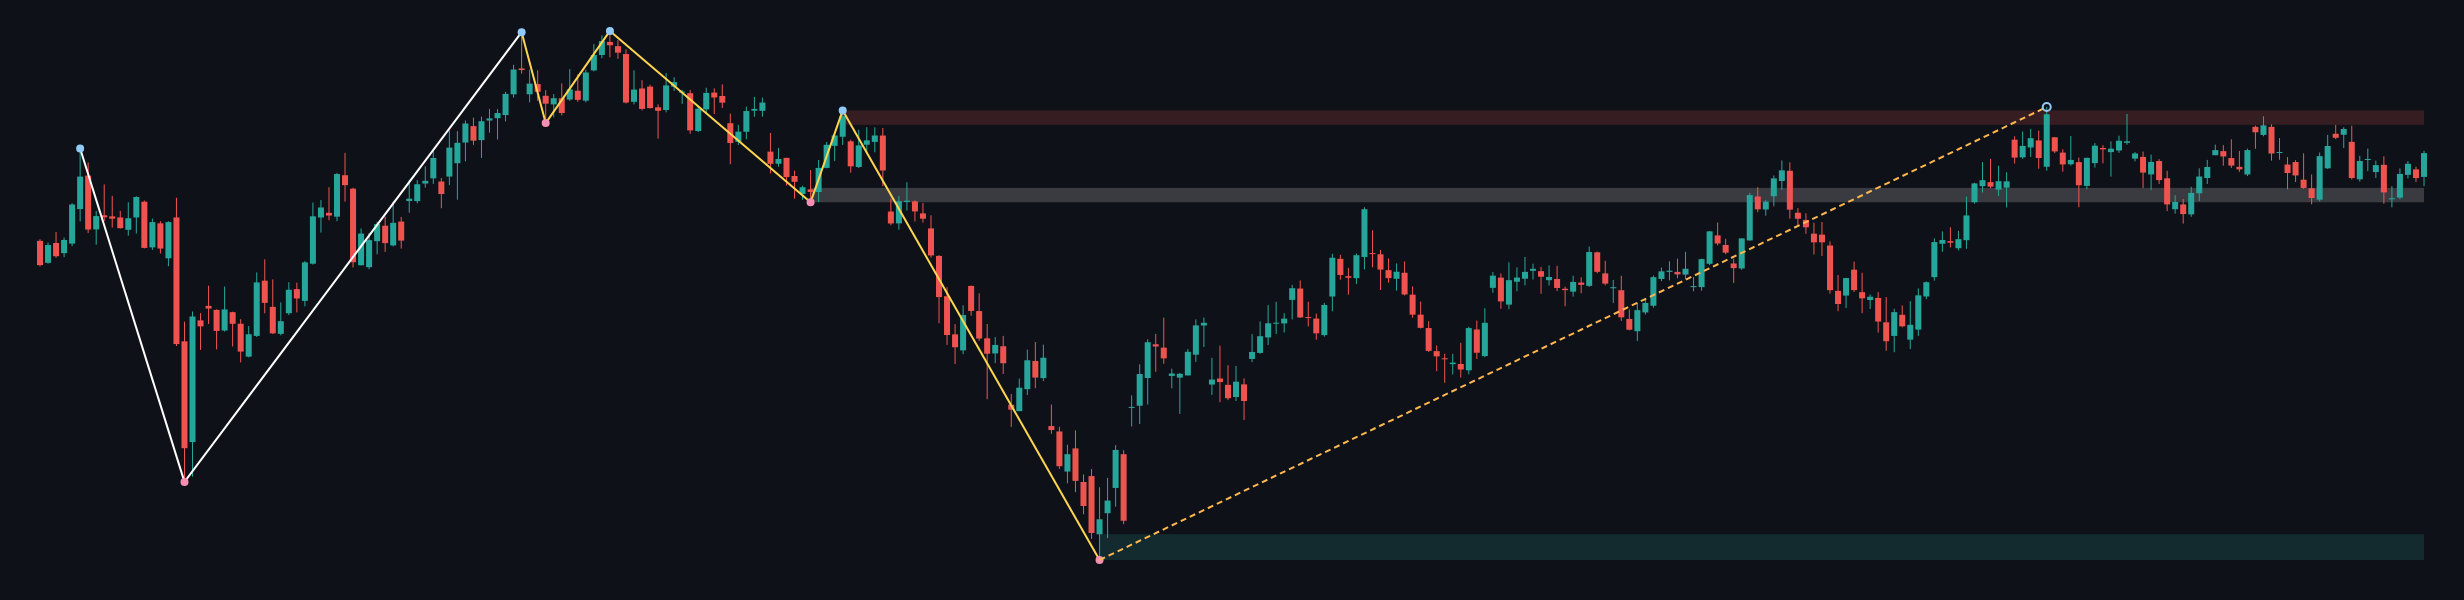
Weekly conclusion: the higher timeframe permits further upside while the sub-trend remains constructive, but the firm primary downtrend keeps the resistance zone at 1.36587–1.37487 as an important test. A sustained move through that area would be more meaningful than an isolated intraday probe.
Main-frame structure
The daily trend is sideways and firm, with a downward sub-trend. This is not fully aligned with the weekly upward sub-trend, so the daily weakness can be read as either a pullback within the larger correction or an early warning that the corrective phase is losing momentum. No daily structure event has been reported.
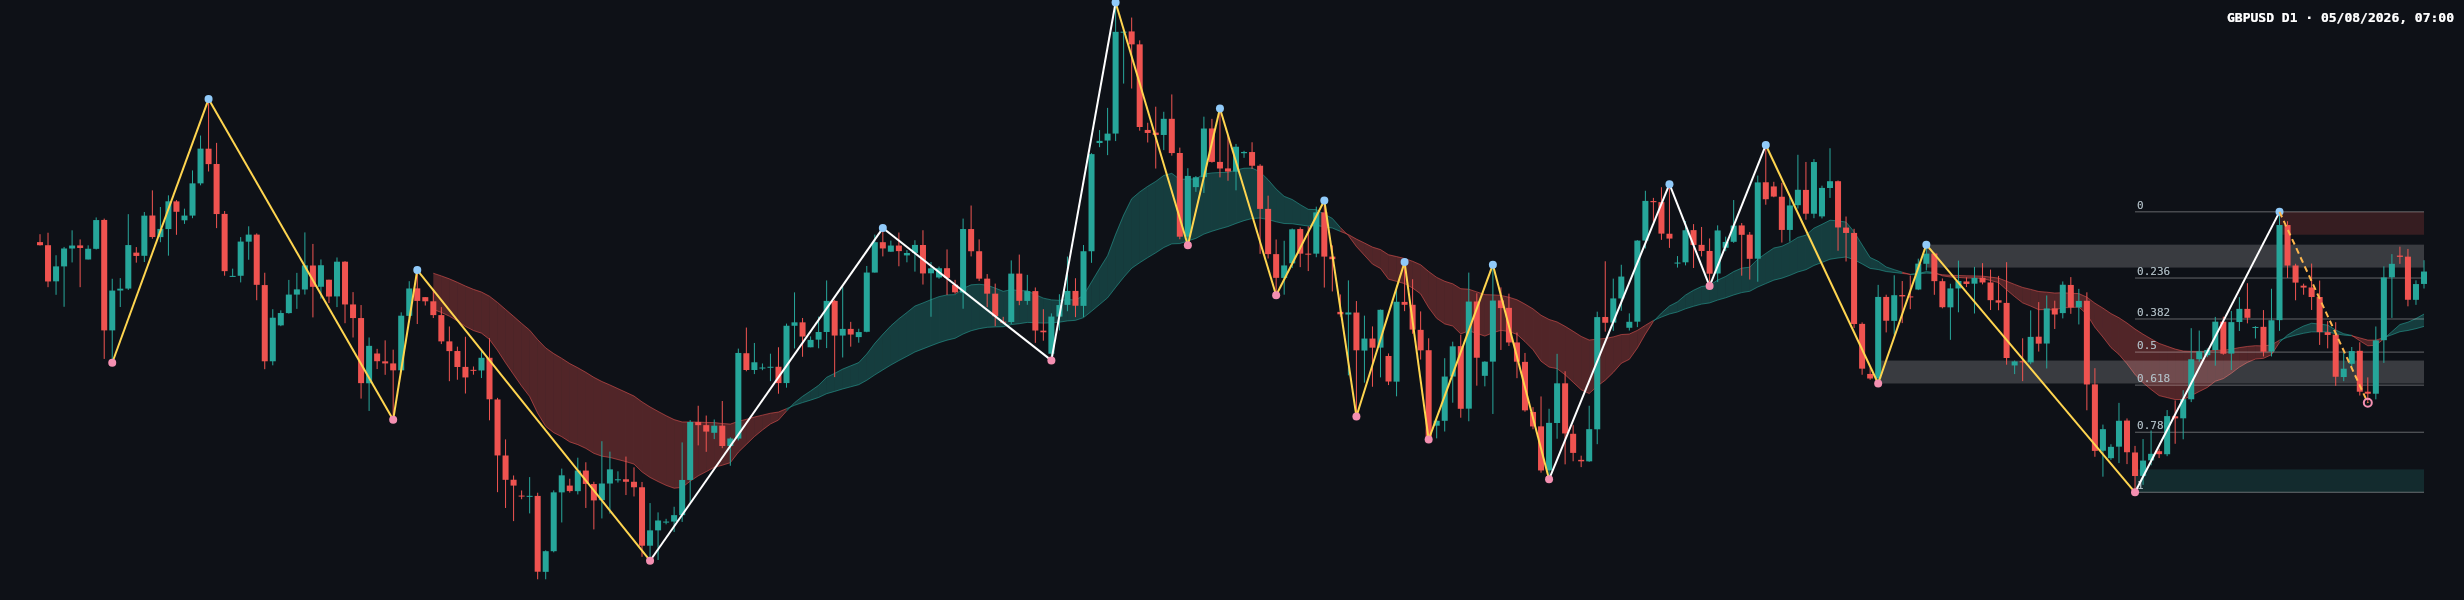
The most recent confirmed daily swing is a high at 1.35580. The daily resistance zone is 1.35239–1.35580, while support is recorded at 1.31395–1.31736. The zone at 1.34749–1.35090 is a broken-retest support area, and 1.33019–1.33360 is a broken-retest resistance area.
The latest completed Dow leg provides Fibonacci levels at 0: 1.35580, 0.236: 1.34592, 0.382: 1.33981, 0.5: 1.33487, 0.618: 1.32994, 0.786: 1.32291, and 1: 1.31395. The current retracement ratio is 0.213, placing price near the 0.236 level at 1.34592.
Daily EMA values, slopes, spacing and crossover status are not determinable from the deterministic report. The daily ATR is 0.00682, indicating that the nearby zones should be assessed in the context of the instrument’s normal daily movement rather than by treating every marginal breach as a confirmed break.
Key levels and recent price action
The latest close at 1.34689 sits below the broken-retest support zone at 1.34749–1.35090 and close to the 0.236 Fibonacci level at 1.34592. This places the market between a recently lost support area above and a nearby retracement reference below.
The most recent candles show a choppy daily sequence, with alternating bullish and bearish bodies and repeated tests of the area around the broken-retest zone. The latest visible price action includes rejection and recovery attempts rather than a clean, one-directional expansion. Exact candle classifications, ranges and wick proportions are not supplied by the deterministic report, so a precise label such as a pin bar or engulfing candle is not used here.
From a buyer-versus-seller perspective, sellers retain short-term control while price remains below 1.34749–1.35090. Buyers would improve the structure by reclaiming that zone and then challenging 1.35239–1.35580. Momentum or volume confirmation is not available in the report.
Scenarios
Primary scenario: continued range pressure
If price remains below 1.34749–1.35090 and breaks beneath 1.34592, the daily sub-trend may continue lower toward 1.33981, followed by the broken-retest resistance zone at 1.33019–1.33360. This scenario is invalidated by a sustained reclaim of 1.35090. It is the preferred conditional interpretation while the close remains beneath the broken-retest support.
Secondary scenario: recovery through broken-retest support
If price reclaims 1.34749–1.35090 and holds above the zone, buyers may challenge daily resistance at 1.35239–1.35580. A move through 1.35580 would place attention on weekly resistance at 1.36587–1.37487. This recovery scenario is invalidated by a renewed move below 1.34592.
Risk or surprise scenario: broader corrective extension
If price breaks above 1.35580 and sustains that breakout, the weekly upward sub-trend could extend toward 1.36587–1.37487. This would challenge the firm weekly downtrend but would not, by itself, remove the higher-timeframe resistance. The scenario is invalidated by a return below 1.35090.
No numerical scenario probabilities are provided in the deterministic report, so the scenarios are ranked qualitatively rather than assigned invented percentages.
Levels and confirmation checklist
- Near resistance: 1.34749–1.35090, the daily broken-retest zone.
- Farther resistance: 1.35239–1.35580, followed by weekly resistance at 1.36587–1.37487.
- Near support: 1.34592, the daily 0.236 Fibonacci level.
- Lower support references: 1.33981, 1.33487, 1.32994, and 1.31395–1.31736.
- Confirmation: a daily close above 1.35090 would support recovery, while acceptance below 1.34592 would favor continuation lower.
Potential traps include false breaks around 1.34749–1.35090, liquidity sweeps near the recent swing high at 1.35580, and reversals that occur before a daily close confirms the move. No relevant news context or exact event time is supplied, so traders should independently check the economic calendar and remain alert to data releases, central-bank communication, currency-market shifts and geopolitical headlines.
For general risk control, avoid treating a single candle as confirmation, keep exposure proportionate to account risk, and consider whether volatility around scheduled news is compatible with the intended analysis. GBPUSD can behave differently across Asian, European and US sessions, with liquidity and volatility often changing as major markets open; the chart itself does not provide a session-specific forecast.
Summary
- The weekly trend is a firm downtrend with an upward sub-trend and no reported structure event.
- The daily market is sideways with a downward sub-trend.
- The close at 1.34689 is below 1.34749–1.35090 and near 1.34592.
- Reclaiming 1.35090 would improve the recovery case; losing 1.34592 would strengthen the bearish continuation case.
- The single most important factor is whether price accepts back above 1.34749–1.35090 or continues below 1.34592.
Hashtags: #GBPUSD #Forex #PriceAction #DowTheory #TechnicalAnalysis
Meta description: GBPUSD remains sideways on the daily chart as price tests 1.34592 below the 1.34749–1.35090 broken-retest zone.
This article is technical analysis and reference information only, not investment advice. Markets carry risk, and readers are responsible for their own decisions.