
GBPUSD is trading at a decision point between conflicting timeframes. The weekly chart retains a firm downtrend, although its sub-trend is up, while the daily chart is formally sideways with a down sub-trend. The latest closed price, 1.34601, is just above the latest completed-leg Fibonacci level at 0.236: 1.34592 and remains below the nearby daily broken-retest zone at 1.34721–1.35090.
Higher-timeframe context — Weekly
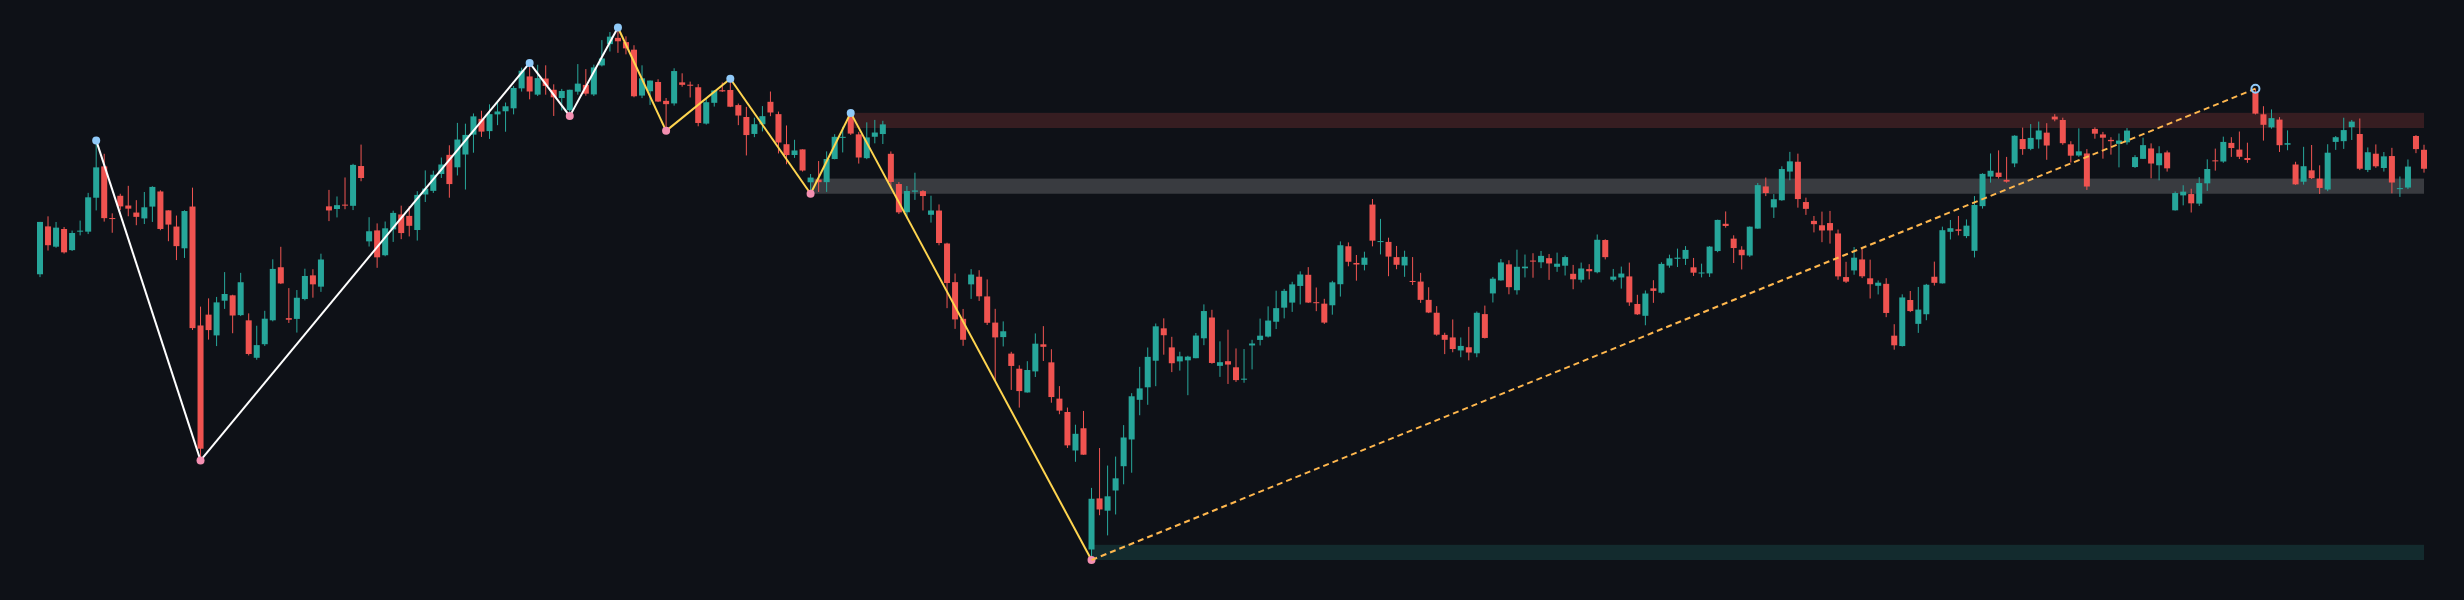
The weekly structure remains biased lower because the main trend is recorded as down and firm. However, the weekly sub-trend is up, showing that the market has been recovering from the most recent confirmed swing low at 1.07621. No weekly structure event is recorded, so there is no confirmed break that would formally overturn the larger trend.
Price is positioned above the former weekly support zone at 1.31602–1.32591, which is marked as a broken-retest area, but below weekly resistance at 1.35906–1.36895. This places GBPUSD between a reclaimed former support area and a larger overhead supply zone rather than in open space.
The broader weekly demand area is 1.07621–1.08610. It is substantially below the current market and is therefore a distant structural reference rather than an immediate daily decision area. The weekly ATR is 0.01979, indicating that the higher-timeframe range is materially wider than the current daily ATR of 0.00739.
Weekly moving-average values and their exact spacing are not determinable from the supplied report. The higher-timeframe conclusion is conditional: the weekly recovery can continue while price holds above the broken-retest area at 1.31602–1.32591, but the firm downtrend remains the governing context while 1.35906–1.36895 caps the advance.
Main-frame structure — Daily
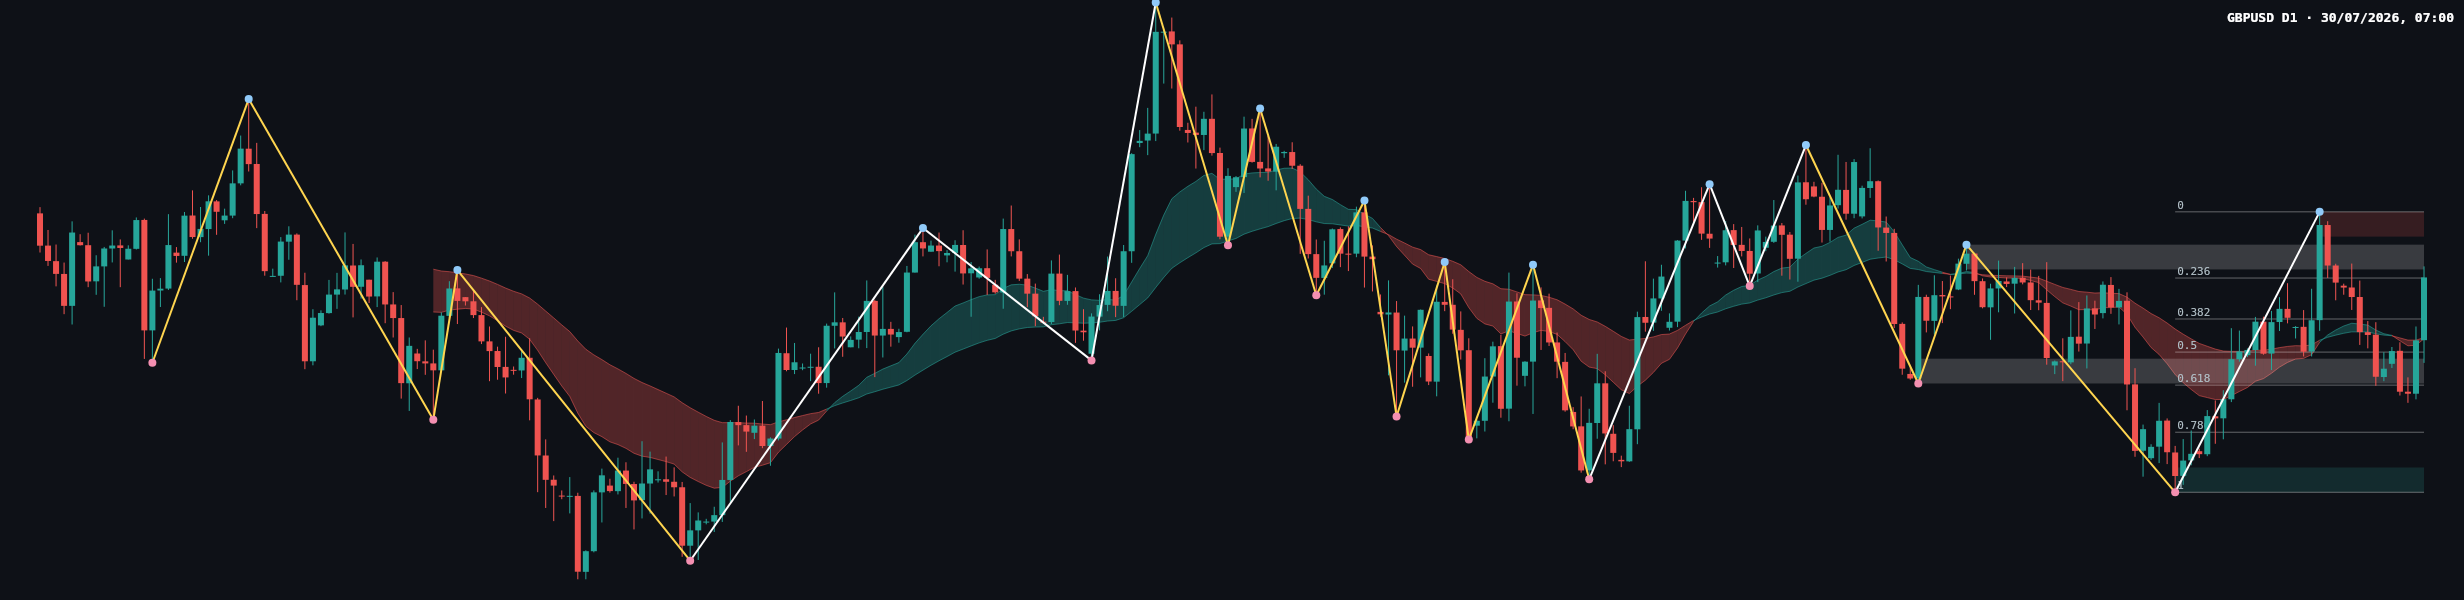
The daily chart is classified as sideways with a down sub-trend, so it does not currently align cleanly with the weekly recovery phase. This can still represent a pullback within the weekly sub-trend, but sustained weakness beneath the daily support structure would increase the risk that the recovery is losing momentum.
The most recent confirmed daily swing is a high at 1.35580. No daily structure event is recorded. Consequently, a move through that swing high would be needed to strengthen the bullish structural case, while continued failure below the nearby resistance areas would preserve the range-bound and bearish interpretation.
The daily zones are clearly layered. The nearest overhead resistance is 1.35211–1.35580. Below the current close, the latest completed-leg Fibonacci reference is 0.236: 1.34592, followed by 0.382: 1.33981, 0.5: 1.33487, and 0.618: 1.32994. The lower daily support zone is 1.31395–1.31764, while 1.33019–1.33388 is identified as a broken-retest resistance zone.
The current retracement ratio is 0.234, close to the 0.236 Fibonacci reference. That proximity makes 1.34592 an important test: holding above it would leave room for a recovery toward 1.34721–1.35090, while a decisive move below it would expose the lower Fibonacci references.
Exact moving-average values, candle-volume readings, and momentum measurements are not determinable from the deterministic report. The chart nevertheless shows a compressed, overlapping daily environment rather than a clean directional expansion. Buyers are attempting to stabilize near the current Fibonacci area, while sellers retain control of the shorter-term structure below 1.35211–1.35580.
Key levels and the latest closing candle
| Area | Level | Role |
|---|---|---|
| Weekly resistance | 1.35906–1.36895 | Major overhead supply |
| Daily resistance | 1.35211–1.35580 | Immediate ceiling and confirmed swing high |
| Daily broken-retest zone | 1.34721–1.35090 | Recovery area to reclaim |
| Current close | 1.34601 | Near the latest Fibonacci test |
| Fibonacci reference | 0.236: 1.34592 | Immediate downside validation area |
| Lower Fibonacci references | 0.382: 1.33981 and 0.5: 1.33487 | Potential downside objectives in a weaker scenario |
| Daily support | 1.31395–1.31764 | Lower structural support |
The exact candle classification of the latest close is not specified in the deterministic report, so it would be inappropriate to label it a pin bar, engulfing candle, or another formal pattern. What is clear is its location: the close at 1.34601 sits just above 1.34592, below 1.34721–1.35090, and well beneath 1.35211–1.35580. This positioning gives the close a cautious, range-bound interpretation rather than confirming a bullish reversal.
Conditional scenarios
Primary scenario — rejection below daily resistance
If price remains below or is rejected from 1.34721–1.35090, sellers may attempt to press the market back through 1.34592. A sustained move below that Fibonacci reference would put 1.33981, 1.33487, and the broken-retest area at 1.33019–1.33388 into focus. This scenario is invalidated by sustained acceptance above 1.35580.
Secondary scenario — recovery through the broken-retest area
If GBPUSD reclaims 1.34721–1.35090 and then establishes support above 1.35211–1.35580, the daily sub-trend would begin to improve. The next broader upside reference would be weekly resistance at 1.35906–1.36895. This scenario is invalidated if price falls back below 1.34592 after the attempted recovery.
Risk scenario — wider daily range develops
If neither side achieves acceptance beyond the nearby zones, GBPUSD may continue oscillating between the lower Fibonacci references and 1.35211–1.35580. A move below 1.33019–1.33388 would weaken the range structure and expose 1.31395–1.31764. A move above 1.35580 would instead shift attention toward 1.35906–1.36895. This is the least directional interpretation while price remains inside the daily structure.
On balance, the bias is range-to-bearish while price remains below 1.34721–1.35090 and especially below 1.35211–1.35580. The expected environment is defined by the daily ATR of 0.00739, but the actual range will depend on whether the Fibonacci reference at 1.34592 holds.
Key considerations
- Resistance: monitor 1.34721–1.35090, then 1.35211–1.35580, with weekly supply at 1.35906–1.36895.
- Support: the first technical reference is 1.34592, followed by 1.33981, 1.33487, 1.33019–1.33388, and 1.31395–1.31764.
- Confirmation: a daily close above 1.35090 would improve the recovery case, while a daily close below 1.34592 would support the bearish continuation case.
- Traps: watch for false breaks around the narrow Fibonacci and broken-retest areas, particularly when price briefly pierces a zone but closes back inside it.
- Fundamentals: no news or economic-calendar information was supplied with the report. Traders should independently monitor currency-sensitive economic releases and broader dollar drivers before drawing conclusions from a technical break.
Summary
- The weekly main trend is down and firm, while the weekly sub-trend remains up.
- The daily structure is sideways with a down sub-trend and no confirmed structure event.
- The latest close at 1.34601 is testing the 0.236: 1.34592 Fibonacci reference.
- Reclaiming 1.34721–1.35090 would improve the recovery case; failure below 1.34592 would expose lower references.
- The single most important issue is whether price can regain 1.35211–1.35580 or instead accepts below 1.34592.
Meta description: GBPUSD analysis: weekly weakness meets a sideways daily range as price tests 1.34592 below key resistance at 1.35211–1.35580.
This article is technical analysis and reference information only, not investment advice. Markets carry risk, and readers are responsible for their own decisions.