
BTCUSD closed at 84742.75, slightly above the weekly broken-retest zone at 80538.63–84683.30 and the daily Fibonacci level at 84449.64. The daily trend remains firmly up, while the weekly trend is firmly down; price is also below the daily resistance zone, so the picture is constructive but not yet resolved.
Higher-timeframe context
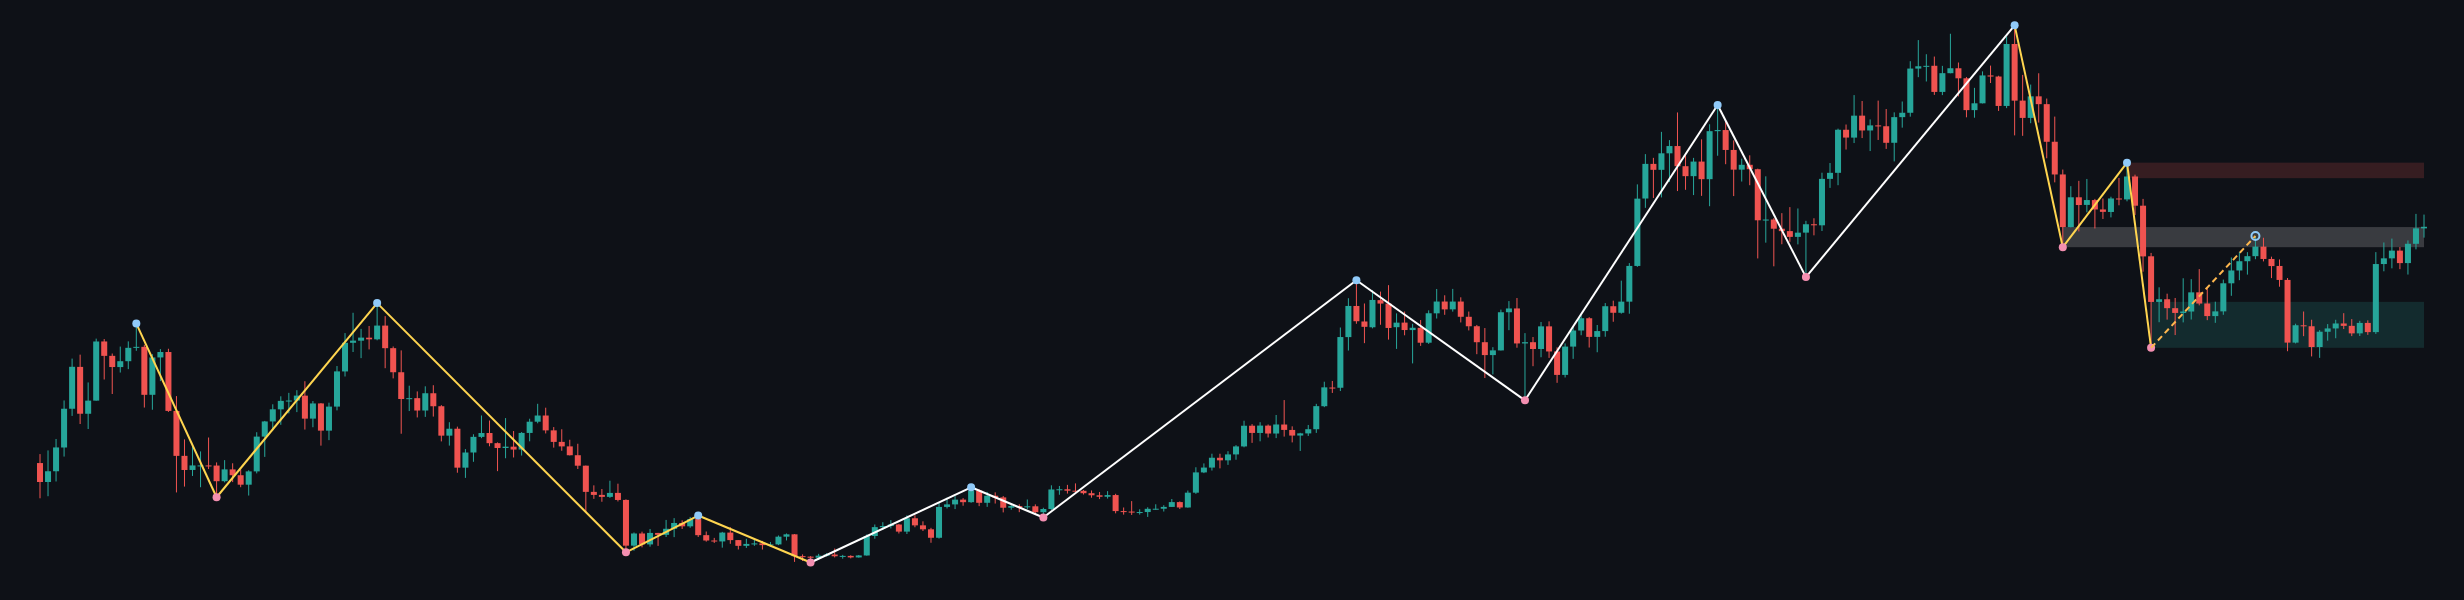
The weekly trend is down, with an upward sub-trend. The most recent confirmed weekly swing is a low at 59783.75, and the report identifies no new structure event. The close is above the former resistance zone at 80538.63–84683.30, now marked as a broken-retest area. Holding above it would support the possibility of continued recovery, while a move back into or below it would put that retest in question.
Higher overhead, weekly resistance sits at 94783.62–97971.19. The reported weekly support zone is 59783.75–69241.82. These broader levels frame a market where the recent daily advance is occurring against a still-bearish weekly trend.
Main-frame structure
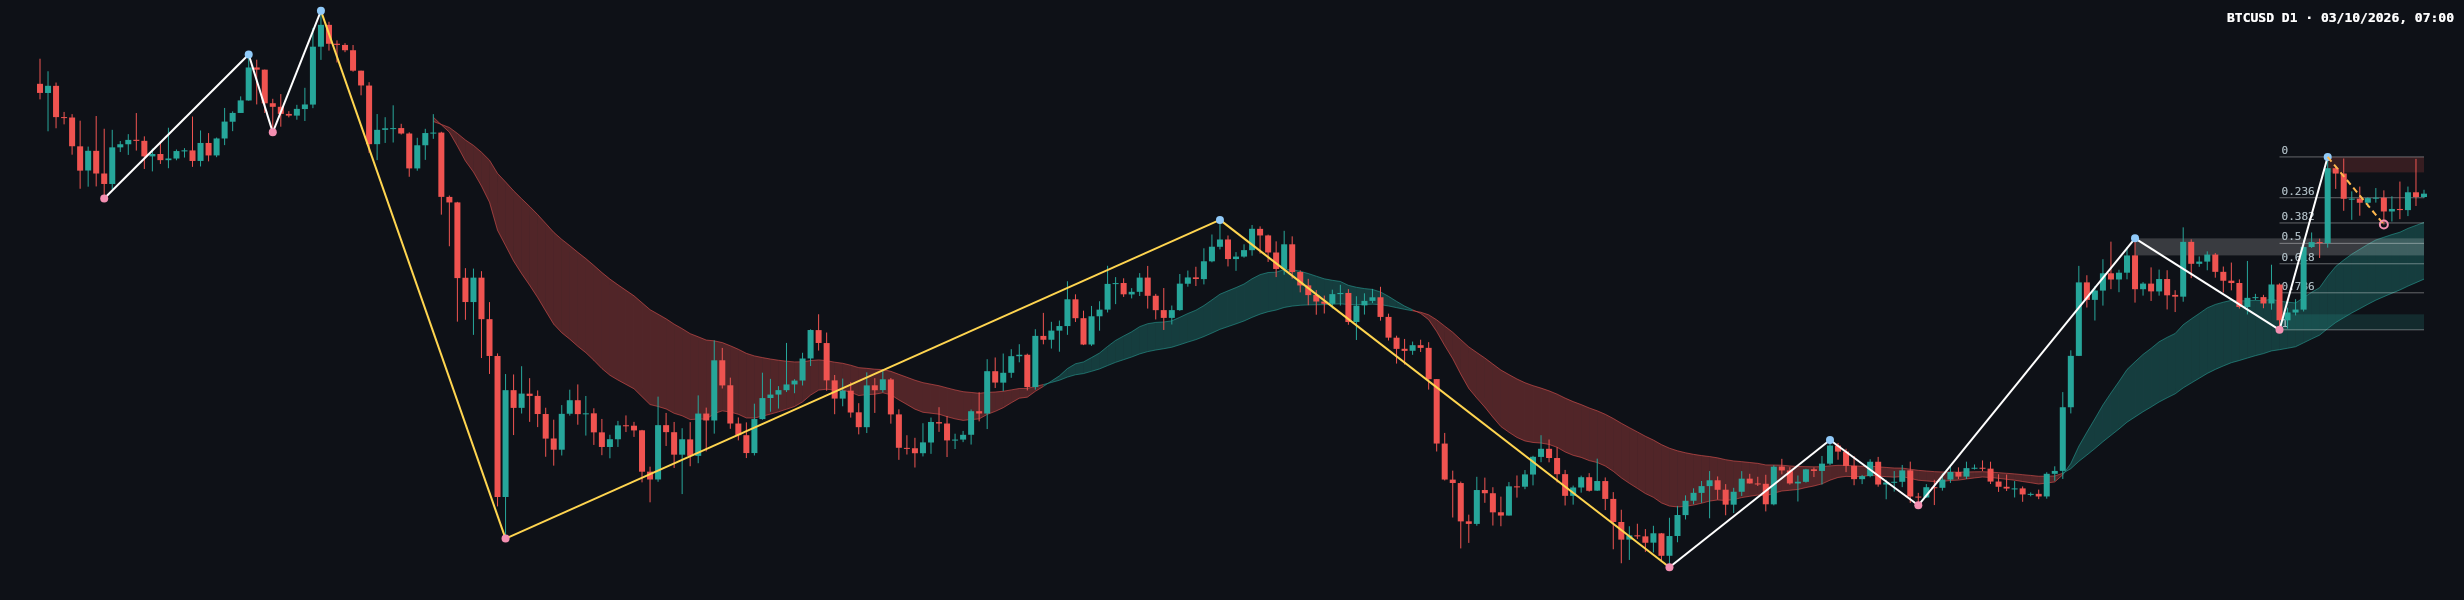
On the daily chart, the main trend is up and the sub-trend is down. The most recent confirmed swing is a high at 87401.93, and no structure event is reported. The pullback within the broader daily advance is therefore visible, but the available data do not confirm a daily trend break.
The latest completed Dow leg has a reported retracement ratio of 0.213. The close at 84742.75 is above the 0.236 Fibonacci level at 84449.64. That places price near the shallow end of the listed retracement levels; it does not, by itself, establish that the pullback has ended. The chart’s moving-average values and volume readings are not included in the deterministic report, so they cannot be assessed here.
Key levels
| Area | Level or zone | Reading |
|---|---|---|
| Current close | 84742.75 | Above the weekly broken-retest zone and the daily 0.236 level. |
| Daily resistance | 86284.29–87401.93 | Overhead barrier, including the most recent confirmed daily swing high. |
| Weekly broken-retest zone | 80538.63–84683.30 | Price is just above the reported zone; a return below it would weaken the hold. |
| Daily broken-retest support | 80277.00–81509.20 | A deeper support area to watch if the pullback extends. |
| Daily support | 74892.24–76009.88 | Further support below the broken-retest area. |
| Weekly resistance | 94783.62–97971.19 | Broader overhead resistance if the daily barrier is cleared. |
Scenarios
- Bullish continuation: A confirmed move above daily resistance at 86284.29–87401.93 would improve the case for a renewed advance. The weekly resistance zone at 94783.62–97971.19 would then be a broader area to monitor, not a guaranteed destination. A return below 80538.63–84683.30 would weaken this scenario.
- Bearish pullback: Rejection from daily resistance followed by a break below the weekly broken-retest zone at 80538.63–84683.30 would shift attention to daily broken-retest support at 80277.00–81509.20. A sustained move below that area would leave the daily support zone at 74892.24–76009.88 in view. Reclaiming 86284.29–87401.93 would weaken this bearish case.
- Consolidation: If price holds above the weekly broken-retest area but remains beneath daily resistance at 86284.29–87401.93, continued two-way trading between those areas would be consistent with consolidation. A confirmed move beyond either boundary would challenge that reading.
The immediate balance is mixed: the daily structure favors the broader recovery, but weekly direction remains down and daily resistance is still overhead. Confirmation at the listed zones matters more than the shallow Fibonacci retracement alone.
This analysis is for technical reference only and is not investment advice. Markets carry risk, and readers are responsible for their own decisions.