
BTCUSD’s daily picture combines a firm uptrend with a downward sub-trend: the latest reported close is 83635.65, while the weekly framework remains down. Price is within the weekly broken-retest resistance zone of 80538.63 – 84683.30, making the response around nearby daily Fibonacci levels and the marked support and resistance zones especially relevant.
Higher-timeframe context
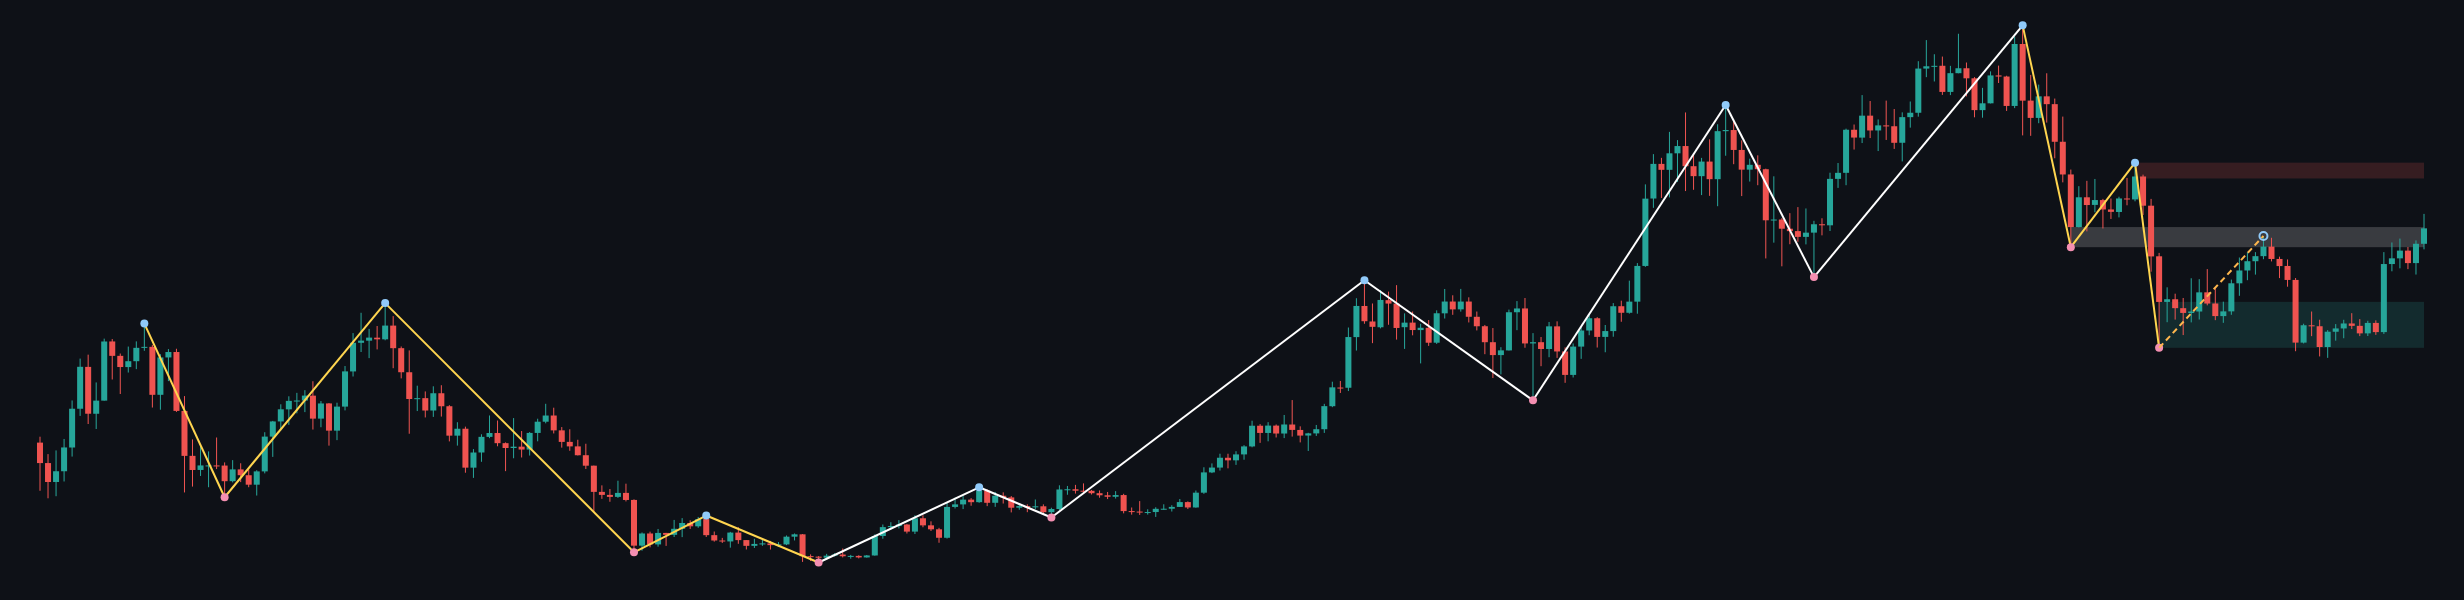
The weekly trend is down, with an up sub-trend and no reported structure event. The most recent confirmed weekly swing is a low at 59783.75. The weekly close of 84422.39 sits inside the 80538.63 – 84683.30 broken-retest resistance zone. This area may therefore act as a test of whether the recent recovery can persist or whether the broader downtrend remains dominant.
Higher weekly resistance is marked at 94721.06 – 97971.19, while broader support is at 59783.75 – 69241.82. The supplied report does not give weekly Fibonacci levels or moving-average readings, so those cannot be assessed here. At this timeframe, the evidence allows for continued recovery within a larger downtrend, but does not confirm a weekly trend reversal.
Main-frame structure
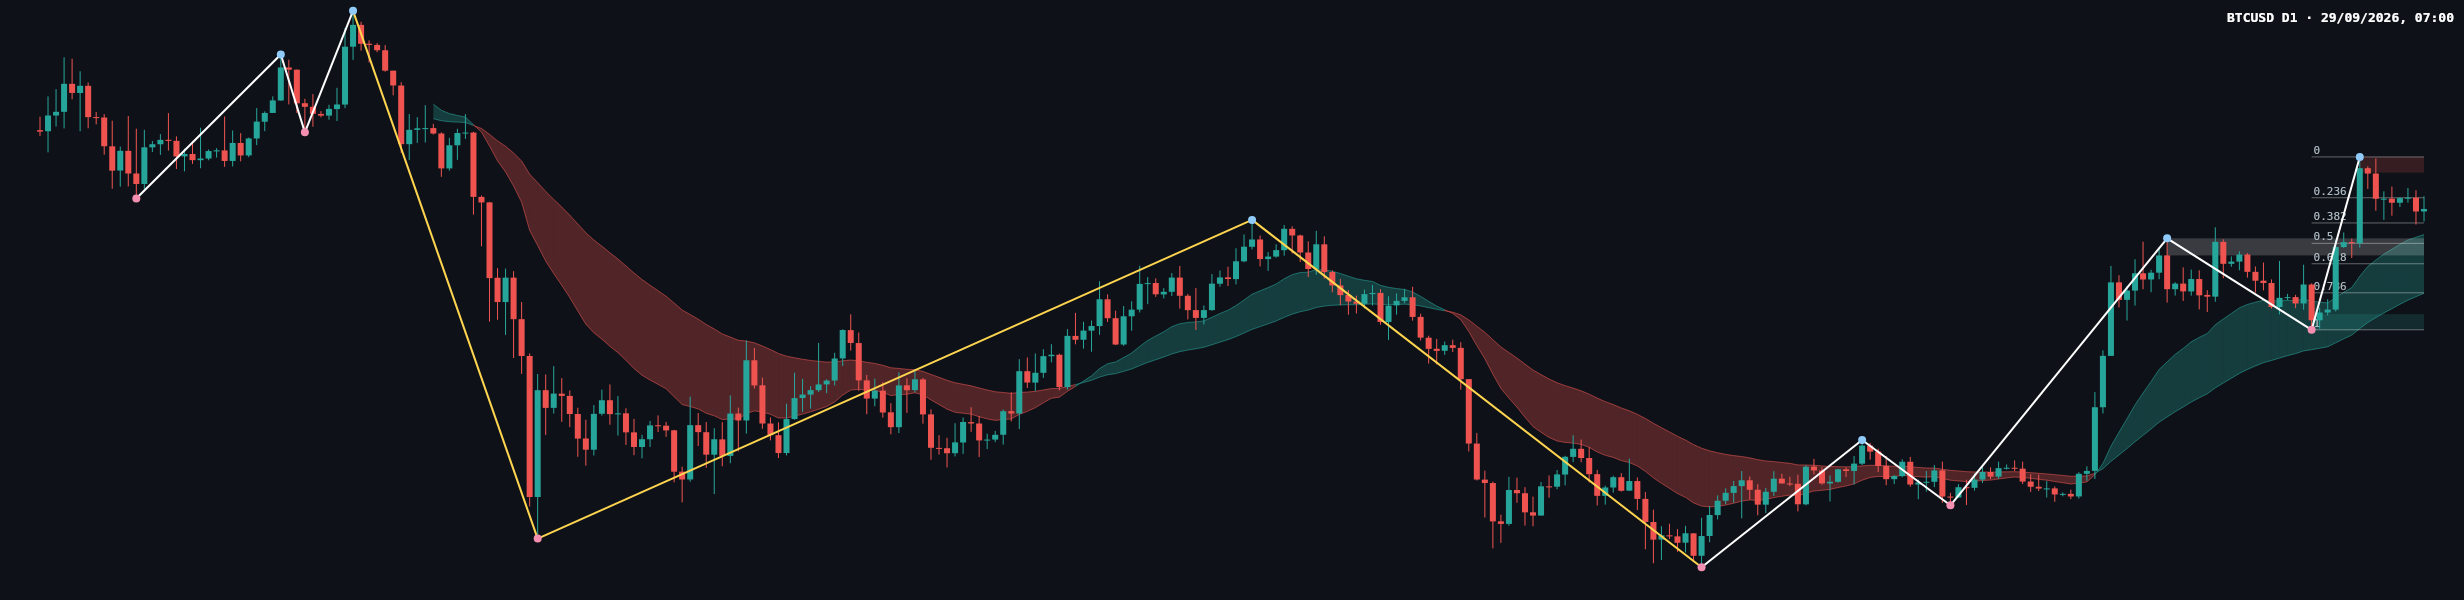
On the daily chart, the main trend is up and the sub-trend is down; no structure event is reported. The most recent confirmed daily swing is a high at 87401.93. The current pullback is consistent with a correction within the broader daily uptrend, but the down sub-trend means buyers have not yet re-established clear control.
The latest daily close, 83635.65, is between the Fibonacci levels 0.236 at 84449.64 and 0.382 at 82623.23. The reported retracement ratio is 0.301. This places price within the ongoing retracement rather than at either of those exact Fibonacci levels. The image suggests recent consolidation after a sharp advance and pullback, but the report does not provide candle OHLC data, volume, or precise moving-average readings. A specific candle pattern, range comparison, or EMA relationship is therefore not determinable from the supplied data.
Key levels
| Area | Reported level | Technical context |
|---|---|---|
| Daily resistance | 86272.40 – 87401.93 | Overhead zone, including the latest confirmed daily swing high. |
| Daily broken-retest support | 80277.00 – 81509.20 | A key area to watch if the pullback extends. |
| Daily support | 74892.24 – 76021.77 | Lower support zone if price moves through the broken-retest area. |
| Weekly broken-retest resistance | 80538.63 – 84683.30 | The weekly close is within this zone. |
| Higher weekly resistance | 94721.06 – 97971.19 | A broader resistance area above the current market. |
| Broader weekly support | 59783.75 – 69241.82 | Major lower-timeframe context support. |
Other daily Fibonacci references are 0.5 at 81147.08, 0.618 at 79670.94, 0.786 at 77569.31, and 1 at 74892.24. These are reference levels, not independent confirmation of a reversal. The nearest decision areas are the daily resistance zone overhead and the broken-retest support zone below.
Conditional scenarios
Recovery scenario
If price breaks and holds above daily resistance at 86272.40 – 87401.93, the daily uptrend would gain confirmation and the higher weekly resistance zone at 94721.06 – 97971.19 would become a potential area of interest. A move back below 86272.40 would weaken that breakout scenario. This remains conditional: the weekly trend is still down.
Pullback continuation
If price fails to clear daily resistance and moves lower, the 80277.00 – 81509.20 broken-retest zone is the next key area to assess. A sustained move beneath this zone would expose daily support at 74892.24 – 76021.77. A recovery back above 81509.20 would weaken the case for continued downside through the retest area.
Range and rejection risk
If neither boundary is decisively cleared, price may continue to fluctuate between the marked daily support and resistance areas. Rejection from 86272.40 – 87401.93 would keep downside pressure in view; a firm response from 80277.00 – 81509.20 would instead suggest that support is holding. No probability estimates are supplied because the report contains no probability data.
Confirmation should come from how price behaves at the relevant zone, rather than from an isolated move through a level. False breaks are possible, and the supplied material contains no news calendar or event times to assess potential catalysts.
Summary
- The daily trend is up, but the daily sub-trend is down.
- The weekly trend remains down, with price testing weekly broken-retest resistance at 80538.63 – 84683.30.
- The daily Fibonacci retracement ratio is 0.301, between 0.236 at 84449.64 and 0.382 at 82623.23.
- Daily resistance at 86272.40 – 87401.93 and broken-retest support at 80277.00 – 81509.20 frame the main scenarios.
The single most important consideration is whether price can reclaim daily resistance or instead extends its pullback toward the marked support zones.
#BTCUSD #Bitcoin #TechnicalAnalysis #DailyMarketAnalysis #PriceAction
Meta description: BTCUSD daily analysis of the current pullback, Fibonacci retracement, and key support and resistance zones.
This article is technical analysis for reference only and is not investment advice. Markets carry risk, and readers are responsible for their own decisions.