
BTCUSD presents a mixed multi-timeframe picture. The D1 report shows a close at 86199.00, above its listed resistance band, alongside a change-of-character event at 82844.58. The weekly frame remains in a firm downtrend, with its last close inside a broken-retest zone; whether the daily recovery can persist is the central question.
Higher-timeframe context
The W1 main trend is down, while its sub-trend is up. The latest confirmed weekly swing is a low at 59783.75, and the report records no weekly structure event. The W1 last closed price, 81237.55, sits within the 80538.63–84683.30 broken-retest resistance zone. That area is therefore an important test for the weekly recovery, rather than evidence that the broader downtrend has already reversed.
The higher resistance zone is 94752.29–97971.19, while weekly support is 59783.75–69241.82. Weekly ATR is 6437.79. The report does not provide weekly Fibonacci levels or moving-average readings, so those cannot be assessed here.
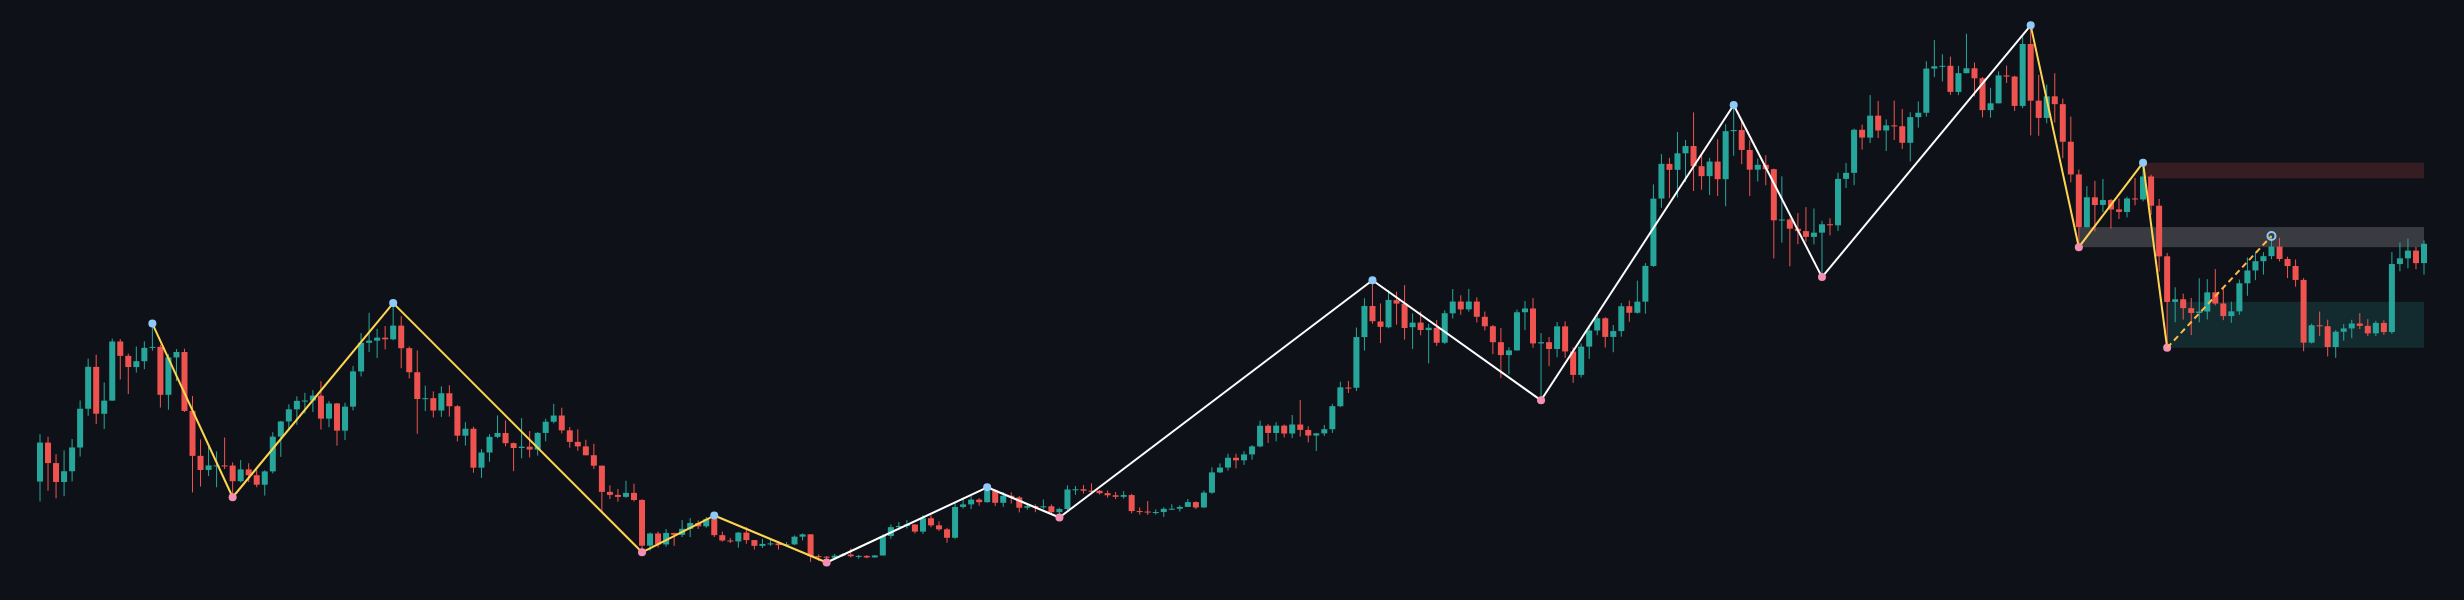
For the W1 framework, holding above the broken-retest band would help sustain the upward sub-trend, but the firm downtrend remains the larger backdrop. Failure to hold the band would leave the weekly support zone relevant as a broader reference.
Main-frame structure
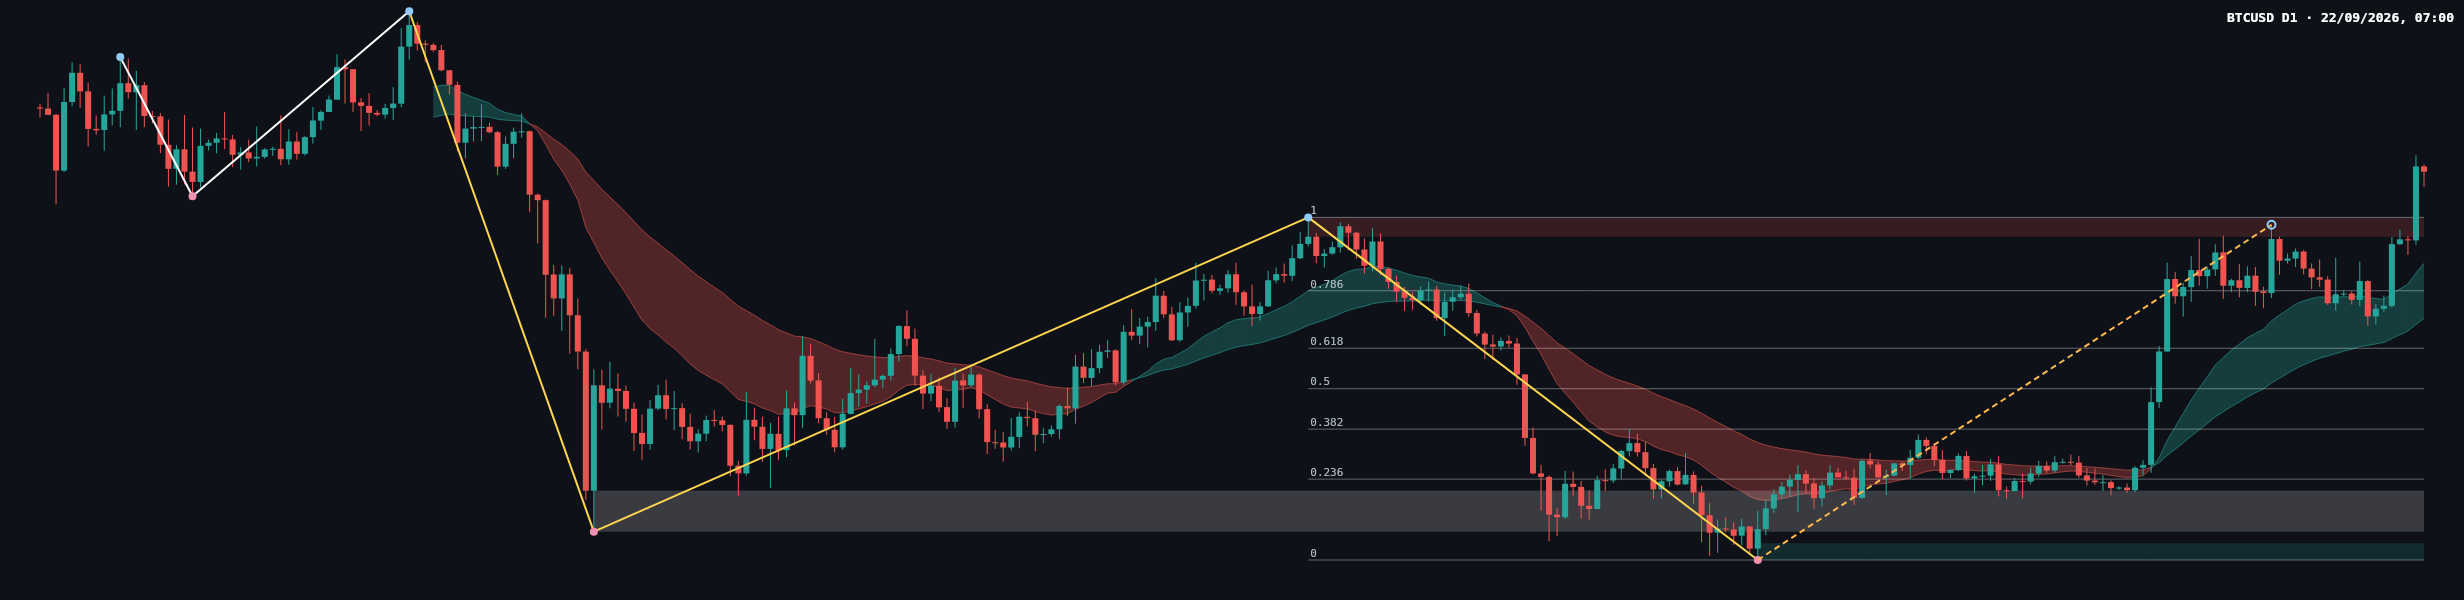
On D1, the main trend is down but described as shaky, with an upward sub-trend. The report identifies a CHoCH at 82844.58. The D1 close at 86199.00 is above the 81426.29–82844.58 resistance zone, making acceptance above the former ceiling a key condition for the recovery case. The weekly and daily closes are reported separately; each should be read within its own timeframe.
The latest completed Dow leg has Fibonacci levels at 0: 57704.79, 0.236: 63637.78, 0.382: 67308.19, 0.5: 70274.69, 0.618: 73241.18, 0.786: 77464.66, and 1: 82844.58. The reported current retracement ratio is 1.000. The close is above the listed 1 endpoint, so these levels are useful retracement references but do not supply an upside extension target.
D1 ATR is 2474.47. The chart image shows recent rising price action, but the deterministic report does not describe individual candle shapes, candle ranges, volume, or momentum. It also provides no EMA values. A precise candle-by-candle or moving-average assessment would therefore go beyond the available data.
Key levels
- D1 resistance: 81426.29–82844.58, with the reported close above the band.
- W1 broken-retest resistance: 80538.63–84683.30; the W1 close is within this area.
- Higher W1 resistance: 94752.29–97971.19.
- D1 broken-retest resistance: 59783.75–62793.85.
- D1 support: 57704.79–58942.03.
- W1 support: 59783.75–69241.82.
- D1 Fibonacci references: 77464.66, 73241.18, 70274.69, 67308.19, 63637.78, and 57704.79.
The nearby structure to monitor is the D1 resistance band in relation to the reported close, with the overlapping weekly zone adding higher-timeframe context. The report does not provide a closer support zone below the current D1 close, so no nearer downside level should be inferred.
Scenarios
Bullish continuation
If BTCUSD holds above 81426.29–82844.58 and maintains acceptance beyond the former D1 resistance, the upward daily sub-trend could remain in play. The next stated higher resistance reference is 94752.29–97971.19 on W1; it is a broad context zone, not a forecast. A move back below 81426.29–82844.58 would weaken this scenario.
Bearish pullback
If price falls back below 81426.29–82844.58 and cannot reclaim that band, the breakout would be less convincing and the daily recovery could unwind. The listed Fibonacci level at 77464.66 is a lower reference, followed by 73241.18. A sustained recovery back above 82844.58 would weaken this pullback case.
Range and failed-break scenario
If price moves around the resistance band without clear acceptance above it or a decisive rejection below it, the structure may remain unresolved. The W1 broken-retest zone at 80538.63–84683.30 provides additional context for that uncertainty. A hold above the D1 band would argue against immediate breakdown; a return beneath it would argue against clean continuation. The report supplies no probability estimates, so none are assigned.
Overall, D1 leans toward a recovery attempt while W1 still calls for caution. The most useful confirmation is whether price can sustain acceptance above the D1 resistance band without losing the weekly context zone.
Summary
- The W1 main trend is down, with an upward sub-trend; its last close is within a broken-retest zone.
- The D1 close is above its listed resistance band, following a CHoCH at 82844.58.
- Holding above 81426.29–82844.58 supports the continuation case; losing it raises pullback risk.
- The report does not provide EMA values, volume, or candle-by-candle measurements.
The single most important consideration is whether BTCUSD can sustain acceptance above 81426.29–82844.58 while the weekly resistance context remains in view.
This analysis is technical reference information only, not investment advice. Markets carry risk, and readers are responsible for their own decisions.