
BTCUSD closed at 76544.76. The weekly and daily main trends remain down, although both frames show an upward sub-trend. Price is now positioned below the daily resistance zone at 81426.29–82844.58 and above the latest daily Fibonacci reference at 73241.18, leaving the market at an important decision area.
Higher-timeframe context — W1
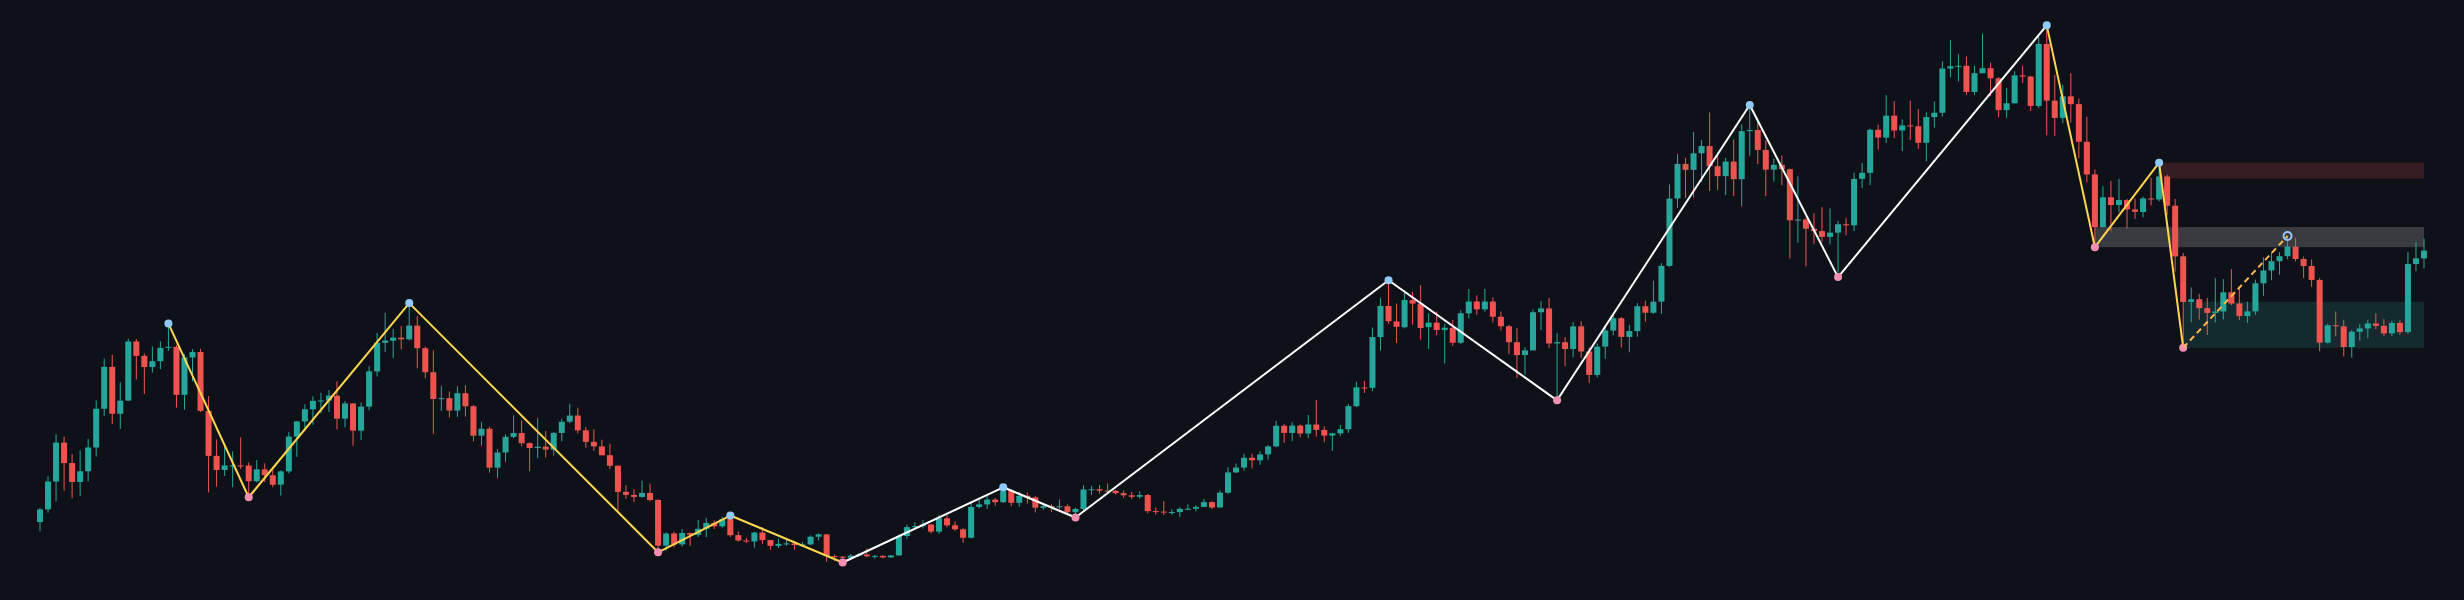
The weekly trend is down and firm, with an upward sub-trend but no confirmed structure event. The most recent confirmed weekly swing is the low at 59783.75. The weekly chart therefore permits a recovery within a broader bearish framework, but it does not yet confirm a lasting reversal.
Weekly resistance is located at 80538.63–84683.30, identified as a broken-retest zone. Above it, the wider resistance area is 94705.30–97971.19. Weekly support is marked at 59783.75–69241.82. With the last closed weekly price at 79827.21, price is close to the lower weekly resistance area rather than trading in clear open space.
The weekly ATR is 6531.77. EMA values and their precise relationship are not provided in the deterministic report, so their slope, spacing and crossover status are not determinable here.
The higher-timeframe conclusion is conditional: sustained acceptance above 80538.63–84683.30 would improve the case for a broader recovery, while rejection from that zone would keep the firm weekly downtrend in control.
Main-frame structure — D1
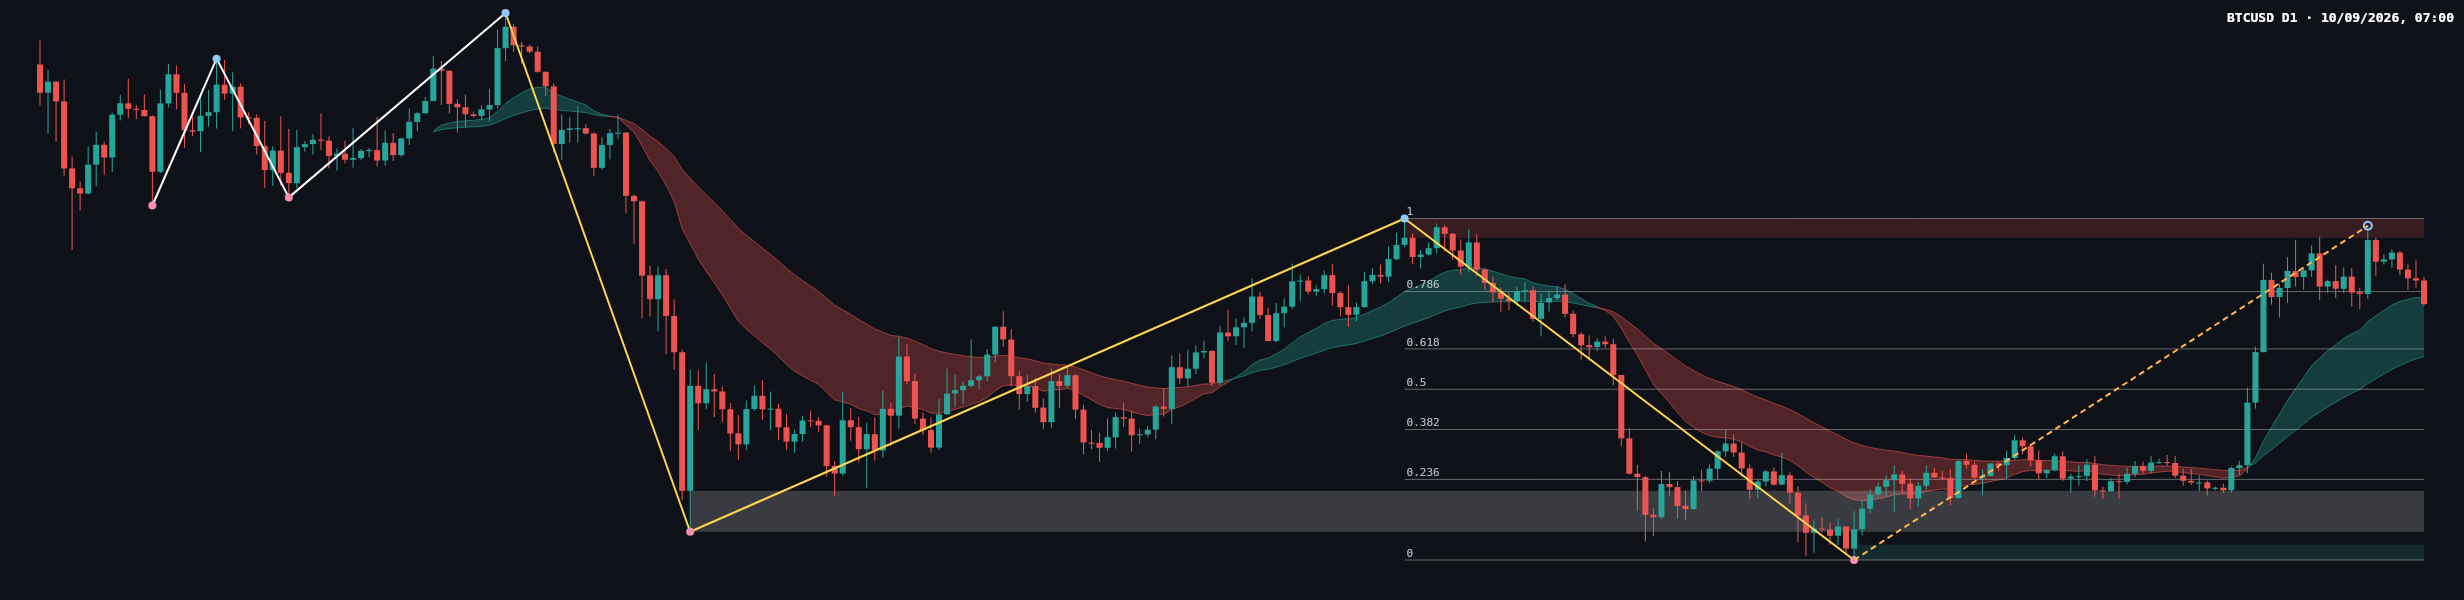
The daily trend is also down and firm, while the sub-trend is up. This aligns the daily directional framework with the weekly chart, meaning the recent rise can be treated as a counter-trend recovery unless price establishes itself above the daily resistance zone at 81426.29–82844.58.
The daily Dow structure has no confirmed structure event. The latest confirmed daily swing low is 57704.79. The daily broken-retest resistance zone is 59783.75–62793.85, now well below the current close and therefore more relevant as a historical structural reference than as immediate resistance.
Daily Fibonacci levels from the latest completed Dow leg are 0: 57704.79, 0.236: 63637.78, 0.382: 67308.19, 0.5: 70274.69, 0.618: 73241.18, 0.786: 77464.66, and 1: 82844.58. The current retracement ratio is 0.749, placing price between 0.618: 73241.18 and 0.786: 77464.66, close to the latter reference.
The daily ATR is 2251.72. EMA values are not listed in the report, so the exact price relationship, slope, spacing and crossover status cannot be determined from the available data.
Key levels and the latest closing candle
The latest daily close is 76544.76, below the Fibonacci reference at 77464.66 and below the resistance zone at 81426.29–82844.58. It remains above 73241.18, which is the nearest clearly defined lower Fibonacci reference in the report.
The chart shows a bearish latest visible candle following the recovery toward the upper resistance area. Exact candle measurements, wick proportions and a formal candle classification are not supplied in the deterministic report, so a precise assessment such as a pin bar, engulfing candle or marubozu is not determinable. The visible close nevertheless indicates that sellers responded before price could establish a confirmed break above resistance.
A daily close above 77464.66 would restore the immediate recovery structure, but a stronger confirmation would require acceptance above 81426.29–82844.58. Conversely, loss of 73241.18 would weaken the current upward sub-trend and refocus attention on 70274.69 and the broader support zone at 59783.75–69241.82.
Conditional scenarios
- Primary recovery scenario: If BTCUSD reclaims 77464.66 and then breaks above 81426.29–82844.58 with sustained daily acceptance, the recovery could extend toward the weekly resistance area at 94705.30–97971.19. This scenario is invalidated by renewed acceptance below 73241.18.
- Secondary range scenario: If price remains between 73241.18 and 81426.29–82844.58, consolidation between Fibonacci support and overhead resistance would remain the central interpretation. A decisive close outside this range would invalidate the range scenario.
- Bearish risk scenario: If price loses 73241.18, sellers could press toward 70274.69, followed by the broader weekly support zone at 59783.75–69241.82. A recovery back above 77464.66 would weaken this bearish continuation scenario.
The directional bias remains cautious: the short-term sub-trend is upward, but the firm weekly and daily downtrends keep rejection risk elevated below 81426.29–82844.58.
Key considerations
- Resistance: watch 77464.66 as the immediate Fibonacci reference, then 80538.63–84683.30 on the weekly frame and 81426.29–82844.58 on the daily frame. The wider upside resistance is 94705.30–97971.19.
- Support: monitor 73241.18, 70274.69, the weekly support zone at 59783.75–69241.82, and the daily support zone at 57704.79–58830.65.
- Confirmation: bullish confirmation would require a daily close above the relevant resistance zone followed by successful acceptance. Bearish confirmation would require a daily close below 73241.18 and continued weakness beneath 70274.69.
- Traps: false breaks around the resistance zones and short-lived liquidity sweeps can create conflicting signals. A single intraday move should be distinguished from a confirmed daily close.
- Macro monitoring: traders may monitor the DXY, US ten-year yields, the economic calendar, CPI, NFP, FOMC communication, Fed speakers and geopolitical headlines. No specific event time is provided in the report.
- Risk principles: analysis should remain conditional, exposure should be kept proportionate to risk tolerance, and major news can materially change volatility and invalidate a technical scenario.
Summary
- Weekly and daily main trends are down and firm, while the sub-trend is upward.
- The daily recovery is below 81426.29–82844.58, the key resistance zone.
- 77464.66 is the nearest important Fibonacci reference above the latest close at 76544.76.
- A break below 73241.18 would increase the risk of a move toward 70274.69 and lower support.
- The single most important factor is whether price achieves sustained acceptance above 81426.29–82844.58 or loses 73241.18.
This article is technical analysis and reference information only, not investment advice. Markets carry risk, and readers are responsible for their own decisions.