
BTCUSD closed at 79827.21. The broader weekly and daily trends remain down, but both frames identify an upward sub-trend. The market is now recovering toward the daily resistance zone at 81426.29–82844.58, where continuation and rejection scenarios become clearly defined.
Higher-timeframe context
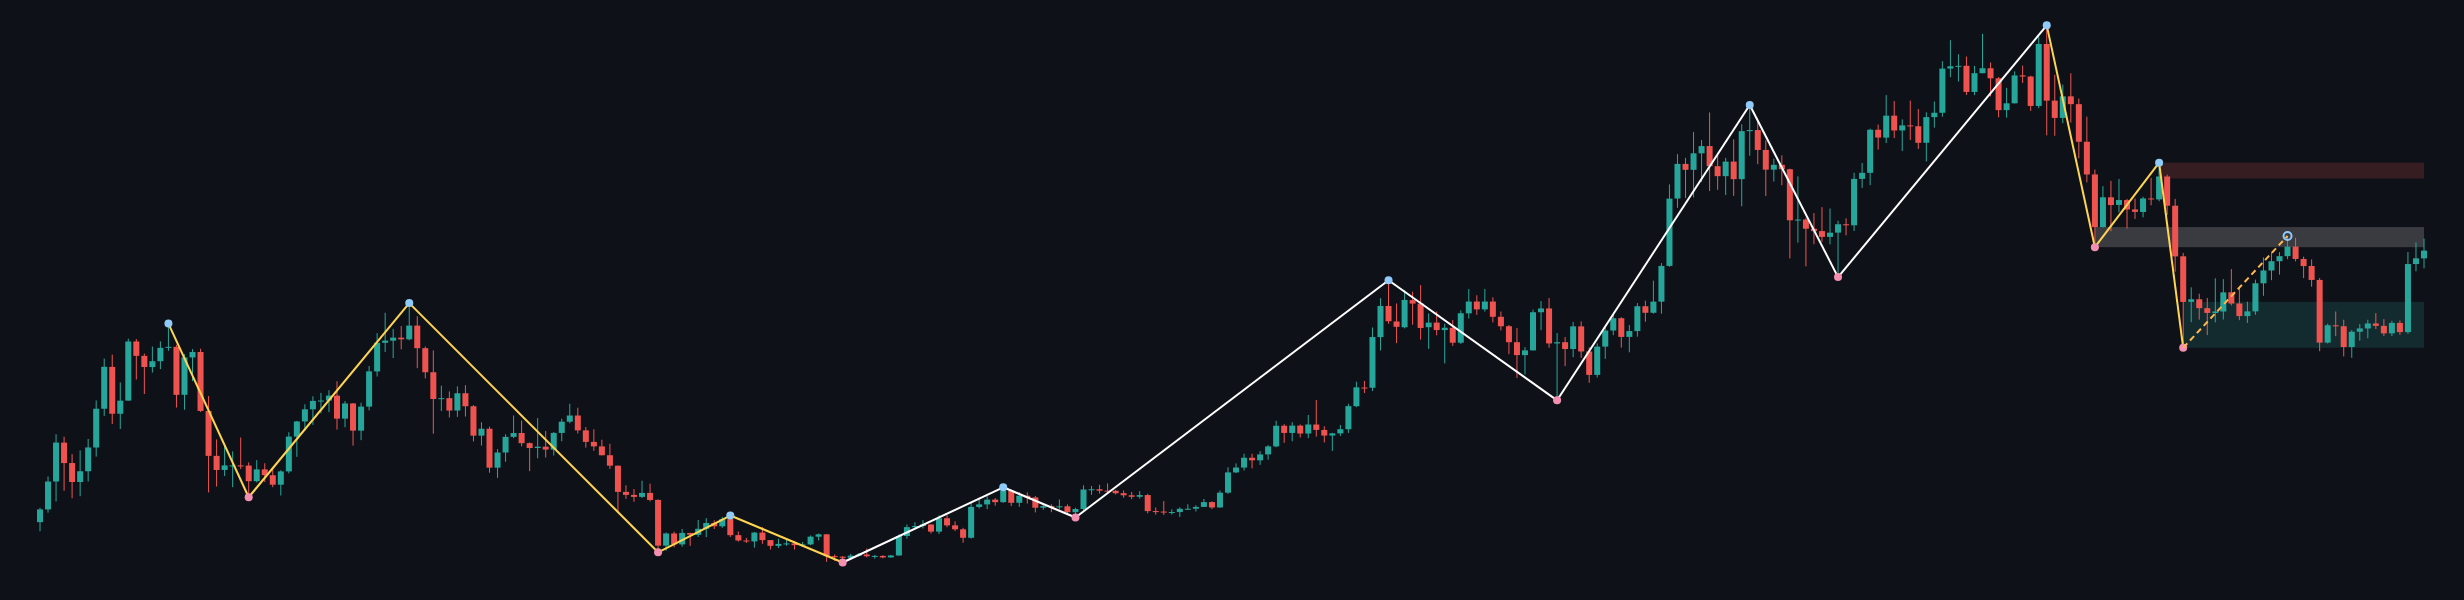
The weekly chart remains in a firm downtrend, with an upward sub-trend and no confirmed structure event. The most recent confirmed weekly swing is the low at 59783.75. This keeps the recovery constructive in the shorter direction, but it has not yet established a confirmed higher-timeframe reversal.
Price is below the weekly broken-retest resistance zone at 80538.63–84683.30. A sustained move through this area would improve the case for a broader recovery, while rejection would preserve the dominant bearish structure. Higher resistance is located at 94705.30–97971.19. The major weekly support zone is 59783.75–69241.82.
The weekly ATR is 6531.77, indicating that the broader market can move materially around these zones. The weekly chart therefore permits further upside while price remains in the current recovery, but it still favors caution around resistance rather than assuming a completed trend reversal.
Main-frame structure
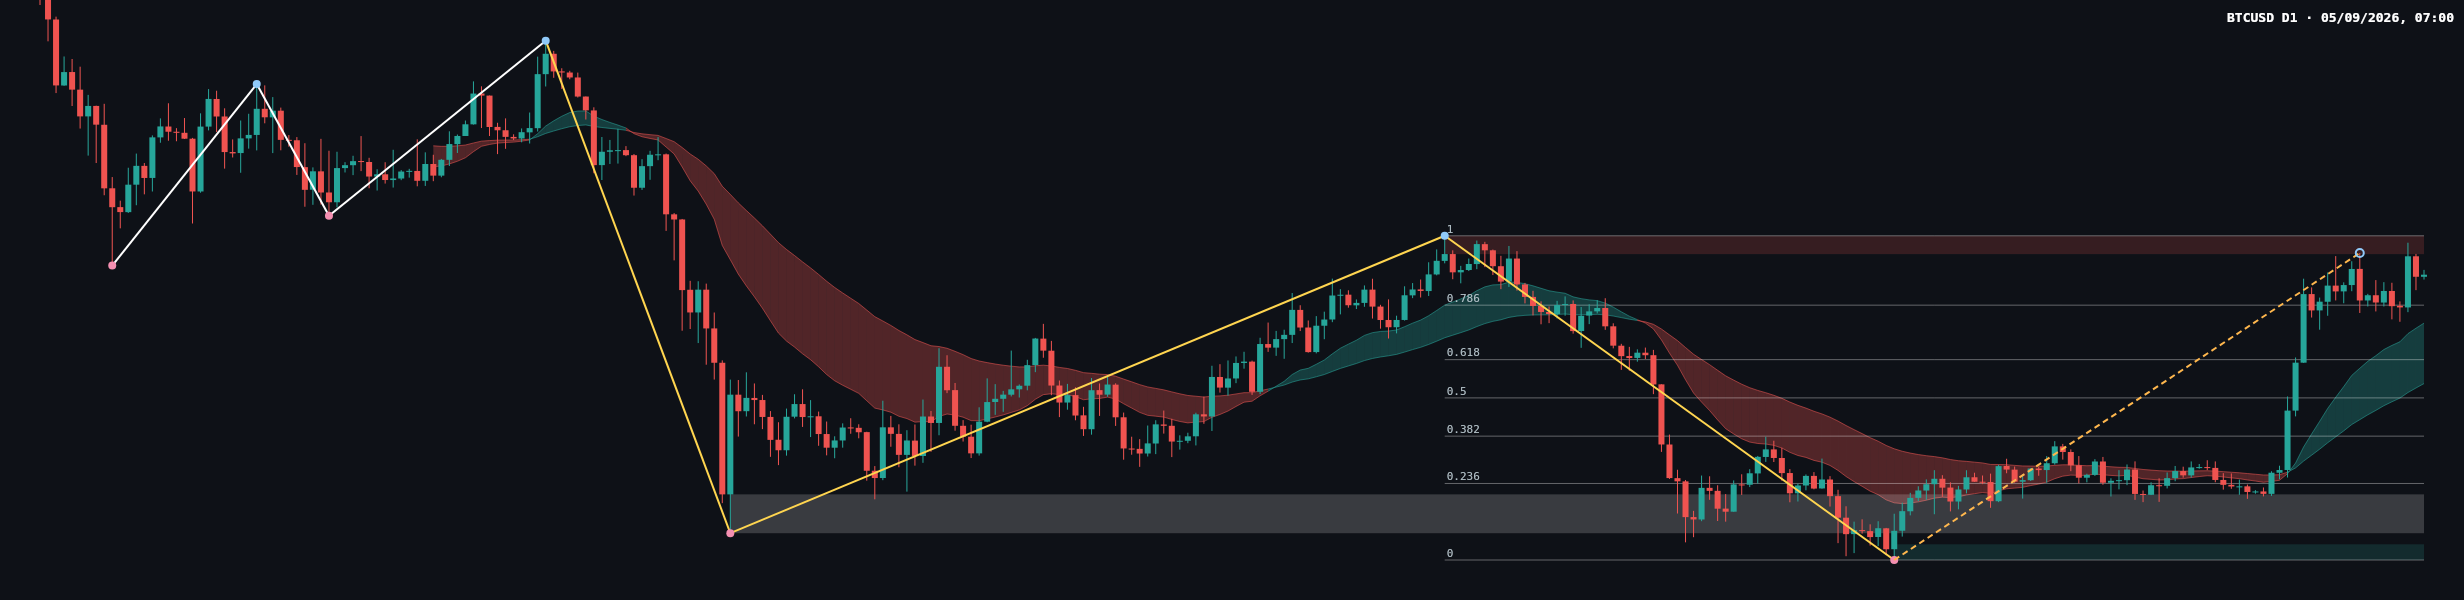
On the daily frame, the main trend is also down while the sub-trend is up. This alignment of the primary direction across both timeframes means that the current rise can be treated as a recovery within a larger bearish structure unless resistance is overcome and subsequently respected as support.
The latest completed daily Dow leg runs from 57704.79 to 82844.58. Its Fibonacci levels are 63637.78 at 0.236, 67308.19 at 0.382, 70274.69 at 0.5, 73241.18 at 0.618, and 77464.66 at 0.786. The current retracement ratio is 0.880, placing price close to the upper end of that completed leg.
No daily structure event is confirmed. The daily broken-retest resistance zone at 59783.75–62793.85 is well below the current market and now functions as a historical reference area. The daily support zone is 57704.79–58919.62. The daily ATR is 2429.67, so price may continue to fluctuate significantly as it tests the nearby resistance zone.
The moving-average ribbon on the chart has turned upward with the recovery, but the broader trend context remains bearish. The latest candles show a sharp upward displacement followed by consolidation near the upper part of the recent range. This indicates that buyers have regained short-term control, while the lack of a confirmed structure event leaves sellers capable of responding at resistance.
Key levels
| Area | Level or zone | Technical role |
|---|---|---|
| Current close | 79827.21 | Reference point for the present recovery |
| Nearest resistance | 81426.29–82844.58 | Daily supply and upper boundary of the latest completed leg |
| Weekly broken-retest resistance | 80538.63–84683.30 | Higher-timeframe test above the current close |
| Higher resistance | 94705.30–97971.19 | Next major weekly supply area if recovery expands |
| Fibonacci reference | 77464.66 at 0.786 | Upper retracement reference below current price |
| Daily support | 57704.79–58919.62 | Major lower support and swing-low region |
Conditional scenarios
Bullish continuation scenario
If BTCUSD breaks above and holds the daily resistance zone at 81426.29–82844.58, the recovery would gain technical confirmation. A successful retest of that zone as support would strengthen the case for continuation toward the weekly resistance zone at 80538.63–84683.30 and, if that broader area is also cleared, the higher resistance zone at 94705.30–97971.19. The scenario would be invalidated by rejection back below 81426.29–82844.58 after the attempted breakout.
Bearish rejection scenario
If price rejects the daily resistance zone at 81426.29–82844.58 and falls back below the recovery structure, sellers would regain control of the immediate narrative. The first meaningful reference on a pullback is the Fibonacci level at 77464.66, followed by the broader support region at 59783.75–69241.82 on the weekly chart. This scenario would be invalidated by sustained acceptance above 82844.58.
Range and failed-breakout scenario
Price may also remain contained between the current close at 79827.21 and the resistance zone at 81426.29–82844.58, producing a range rather than a directional resolution. A move below 77464.66 would weaken the short-term recovery and shift attention toward lower support, while a move above 81426.29 without acceptance would leave the breakout vulnerable to failure. The range scenario is invalidated by a sustained move beyond the resistance zone or a decisive loss of 77464.66.
What to monitor
- Whether the close remains below or is accepted above 81426.29–82844.58.
- Whether 77464.66 continues to act as a recovery reference during any pullback.
- Whether the weekly zone at 80538.63–84683.30 produces rejection or acceptance.
- Whether a new confirmed structure event appears; none is currently reported on either frame.
- Whether movement toward 94705.30–97971.19 develops only after the nearer resistance areas are cleared.
Summary
- The weekly and daily primary trends remain down.
- The sub-trend on both frames is up, supporting the current recovery but not confirming a reversal.
- 81426.29–82844.58 is the central decision zone on the daily frame.
- Acceptance above resistance would improve the bullish case; rejection would favor a return toward 77464.66 and lower support references.
The single most important consideration is how BTCUSD behaves around 81426.29–82844.58.
This article is technical analysis for reference only, not investment advice. Markets carry risk, and readers are responsible for their own decisions.
#BTCUSD #Bitcoin #TechnicalAnalysis #PriceAction #MarketStructure
BTCUSD remains in a broader downtrend while its daily recovery tests the key 81426.29–82844.58 resistance zone.