
BTCUSD is trading at a decision area on the daily chart. The last closed price is 81254.84, just below the daily resistance zone at 81426.29–82844.58. Both the weekly and daily main trends remain down firmly, although each timeframe shows an upward sub-trend. The immediate focus is whether price can establish acceptance above resistance or instead turn lower from the zone.
Higher-timeframe context
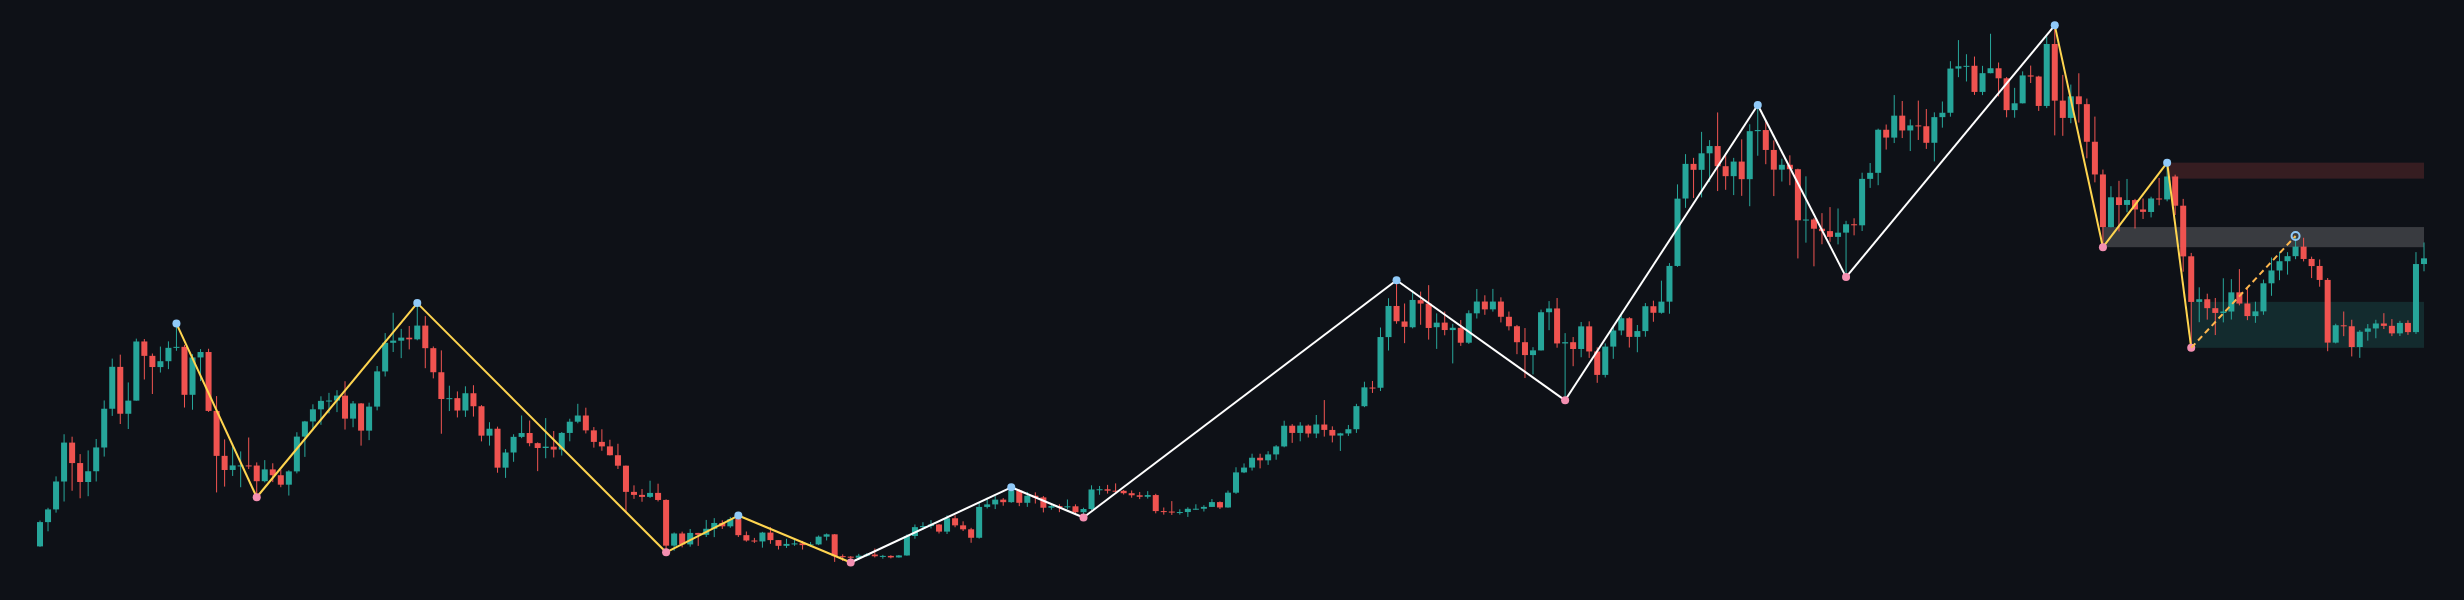
The weekly structure remains classified as a firm downtrend, with an upward sub-trend and no confirmed structure event. The most recent confirmed weekly swing is the low at 59783.75. Weekly price is below the broader resistance zone at 94689.81–97971.19 and is also approaching the broken-retest resistance zone at 80538.63–84683.30.
The weekly support area is 59783.75–69241.82. With the weekly last closed price at 78234.62, this support remains below the market, while the broken-retest area above and around current price remains the more immediate structural reference. The weekly ATR is 6562.77, indicating that the broader market can produce substantial movement around these zones.
The higher-timeframe framework therefore permits an upward continuation within the sub-trend, but it does not yet overturn the primary bearish structure. A sustained move through the broken-retest resistance would improve the bullish case; rejection from that area would keep the broader downtrend in control.
Main-frame structure
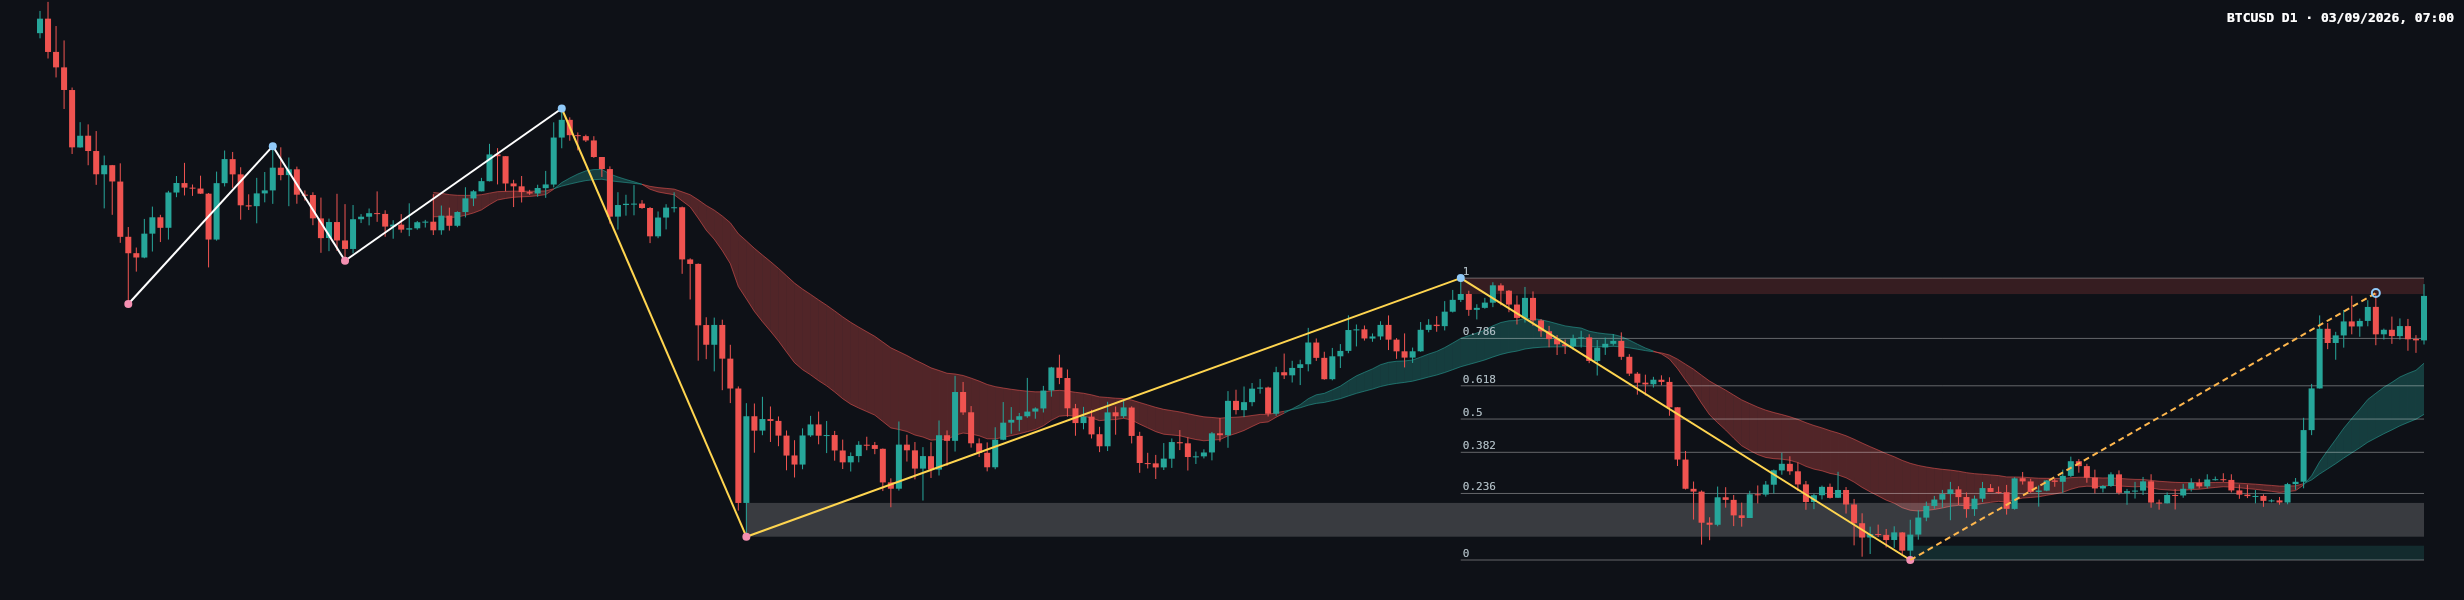
On the daily chart, the main trend is also down firmly, while the sub-trend is up. No daily structure event is confirmed. The latest completed Dow leg runs from the swing low at 57704.79 to 82844.58, and the current retracement ratio is 0.937.
The daily resistance zone at 81426.29–82844.58 is the central decision area. Price has recovered strongly from the lower structure and is now testing the upper boundary of the completed leg. The daily support zone at 57704.79–58974.76 remains the major downside reference, while the broken-retest resistance zone at 59783.75–62793.85 is an important historical area beneath the market.
The daily moving-average ribbons are visible on the chart, but their exact values are not provided in the deterministic report. Their visual configuration should therefore be treated as secondary to the confirmed price zones and Dow structure. The recent advance shows improving short-term demand, but price remains below a major resistance area and the primary daily trend has not changed.
Key levels and Fibonacci map
| Reference | Level or zone | Technical role |
|---|---|---|
| Daily resistance | 81426.29–82844.58 | Immediate decision area |
| Weekly broken-retest resistance | 80538.63–84683.30 | Higher-timeframe overhead supply |
| Weekly resistance | 94689.81–97971.19 | Broader resistance zone |
| Daily broken-retest resistance | 59783.75–62793.85 | Historical structural reference |
| Daily support | 57704.79–58974.76 | Major downside support |
| Weekly support | 59783.75–69241.82 | Broader demand area |
The Fibonacci levels from the latest completed daily Dow leg are 63637.78 at 0.236, 67308.19 at 0.382, 70274.69 at 0.5, 73241.18 at 0.618, 77464.66 at 0.786, with the leg extending from 57704.79 to 82844.58. The current retracement ratio of 0.937 places price close to the upper end of that completed leg, where resistance and failed-breakout risk become more relevant.
Scenarios
Bullish continuation
If daily price closes above the resistance zone at 81426.29–82844.58 and holds that area on a subsequent retest, the upward sub-trend would gain technical confirmation. The next broader reference above is the weekly resistance zone at 94689.81–97971.19. This scenario is invalidated if price loses acceptance above 81426.29 and returns below the resistance area.
Bearish rejection
If price rejects 81426.29–82844.58, particularly after failing to hold above the zone, the daily downtrend remains the dominant framework. The lower Fibonacci references at 77464.66, 73241.18, and 70274.69 become relevant areas for assessing whether the pullback is orderly or developing into a broader decline. The bearish scenario is weakened if price establishes a sustained close above 82844.58.
Range and failed-breakout scenario
Price may also remain contained between the daily resistance zone at 81426.29–82844.58 and the lower Fibonacci references, producing continued two-way trade without a confirmed structure event. A move back toward 77464.66 would show that the latest advance is losing momentum, while a recovery back through 81426.29 would keep the market near the upper boundary. This range scenario is invalidated by sustained acceptance beyond either side of the active decision area.
Reading the latest price action
The latest daily close at 81254.84 sits immediately below the resistance zone at 81426.29–82844.58. The chart shows a sharp recovery into this area followed by hesitation rather than a confirmed daily structure break. That behavior suggests that buyers have improved the short-term structure, but sellers still have an opportunity to defend the established resistance.
The most recent candles should be read through their location rather than through an unsupported candle classification: price is consolidating below resistance after a strong upward displacement. A firm close above 82844.58 would favor continuation, while repeated upper rejection and a return below 81426.29 would favor a pullback. Exact candle-range statistics and indicator values are not determinable from the deterministic report.
Closing view
BTCUSD’s immediate bias is balanced between an upward sub-trend and a firm higher-timeframe downtrend. The key test is the daily resistance zone at 81426.29–82844.58: acceptance above it would improve the continuation case, while rejection would preserve the bearish structure and refocus attention on 77464.66 and the lower Fibonacci references.
#BTCUSD #Bitcoin #TechnicalAnalysis #PriceAction #DowTheory
Meta description: BTCUSD tests 81426.29–82844.58 resistance while weekly and daily trends remain firmly down.
Risk disclaimer: This article is technical analysis and reference information only, not investment advice. Markets carry risk, and readers are responsible for their own decisions.