
BTCUSD is trading at a last closed daily price of 78532.75, with the weekly and daily main trends both classified as down, while the sub-trend on each timeframe is up. The most notable feature is the recovery from the confirmed daily swing low at 57704.79 toward the daily resistance zone at 81426.29–82844.58. This places price near an important decision area rather than in a clearly confirmed reversal.
| Metric | Reading |
|---|---|
| Daily last closed price | 78532.75 |
| Weekly last closed price | 77057.88 |
| Weekly trend | Down, with an upward sub-trend |
| Daily trend | Down, with an upward sub-trend |
| Nearest daily resistance | 81426.29–82844.58 |
| Daily broken-retest resistance | 59783.75–62793.85 |
| Daily support | 57704.79–58888.98 |
| Current daily retracement ratio | 0.828 |
Higher-timeframe context
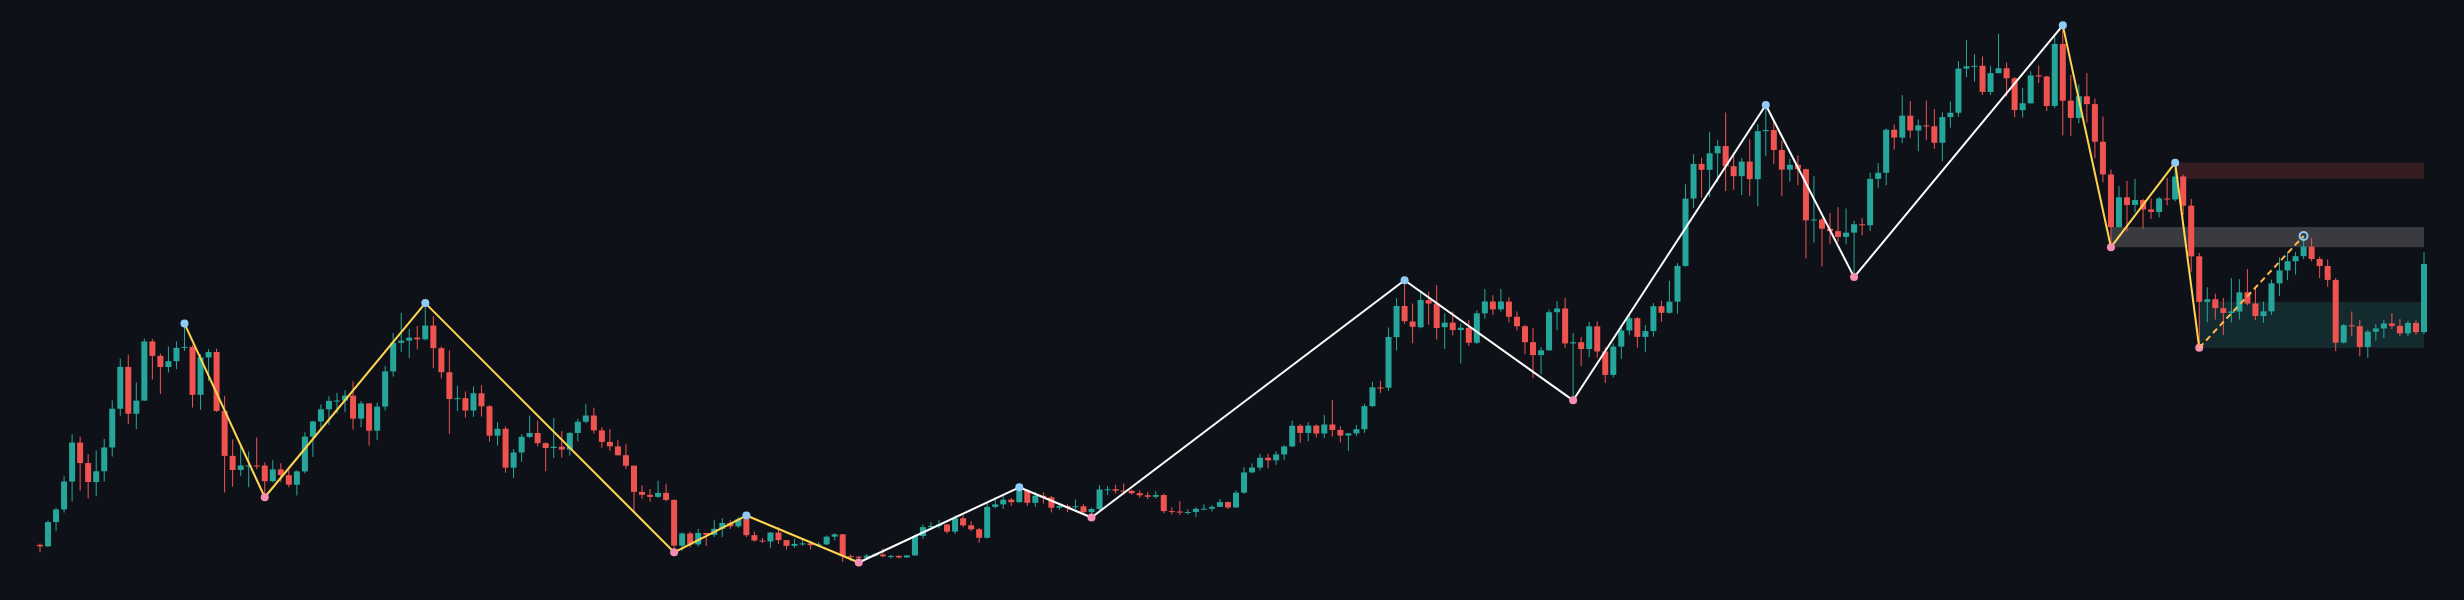
The weekly framework remains a firm downtrend, although the sub-trend is up. The report identifies no weekly structure event, so the recent advance has not yet produced a confirmed higher-timeframe break of structure. The most recent confirmed weekly swing is the low at 59783.75.
Weekly resistance is concentrated at 94666.07–97971.19, while the nearer broken-retest resistance is 80538.63–84683.30. The weekly support zone is 59783.75–69241.82. With the weekly last closed price at 77057.88, the market is approaching the broken-retest area from below. A sustained move through that zone would improve the case for a broader recovery, but rejection would preserve the dominant bearish structure.
The weekly ATR is 6610.23. The report does not provide numerical values for the weekly moving averages, so their exact position, slope, spacing and any crossover are not determinable from the report.
Main-frame structure
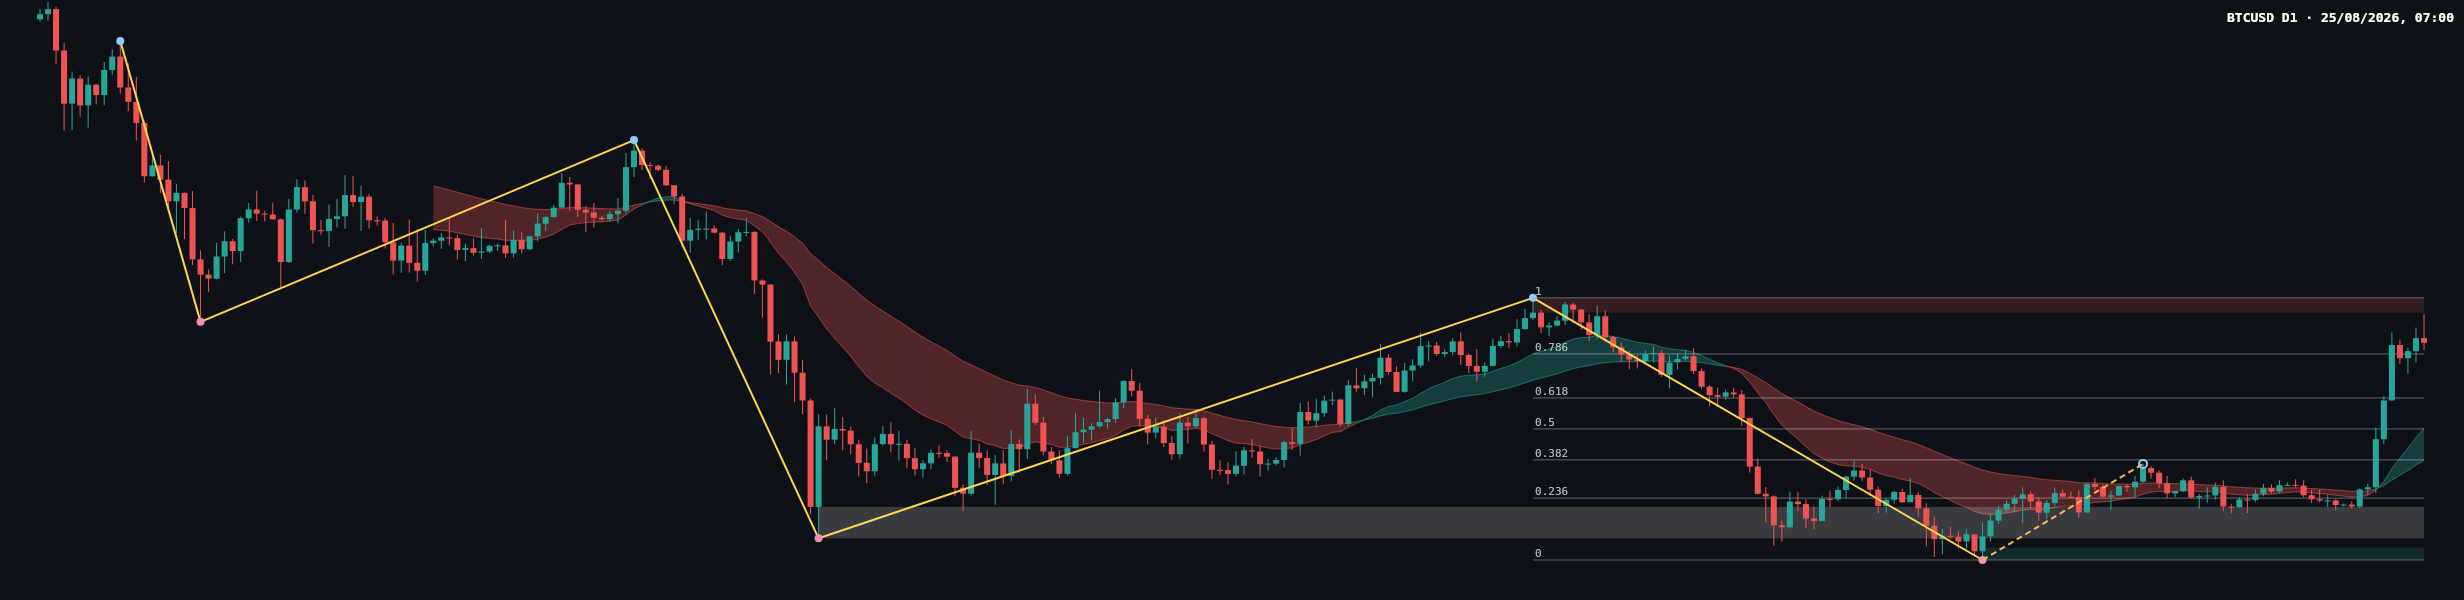
On the daily timeframe, the main trend is also down and firm, while the sub-trend is up. This alignment with the weekly direction means the rise is best treated as a counter-trend recovery until price confirms otherwise. No daily structure event is reported.
The most recent confirmed daily swing low is 57704.79. The daily Fibonacci leg runs from 57704.79 at 0 to 82844.58 at 1. Its listed retracement levels are 63637.78 at 0.236, 67308.19 at 0.382, 70274.69 at 0.5, 73241.18 at 0.618 and 77464.66 at 0.786. The current retracement ratio is 0.828, placing the recovery beyond the listed 0.786 level and close to the upper boundary of the daily resistance structure.
The daily ATR is 2368.38. Numerical moving-average readings are not included in the report, so the exact relationship between price and those averages, including their slope, spacing and crossover status, is not determinable. Volume and momentum readings are likewise not supplied and cannot be used as confirmation here.
Key levels
- 81426.29–82844.58: primary daily resistance and the upper boundary of the completed Fibonacci leg.
- 80538.63–84683.30: weekly broken-retest resistance, overlapping the daily decision area.
- 94666.07–97971.19: major weekly resistance if the recovery extends beyond the nearer supply area.
- 59783.75–62793.85: daily broken-retest resistance that may become relevant on a deeper retracement.
- 59783.75–69241.82: broad weekly support zone.
- 57704.79–58888.98: daily support zone and area surrounding the latest confirmed daily swing low.
Scenarios
Bullish scenario
If BTCUSD establishes acceptance above 81426.29–82844.58, the recovery would gain a stronger technical basis. The next higher-timeframe area to observe would be 80538.63–84683.30 as overlapping structure, followed by 94666.07–97971.19 if the advance continues. A return below 81426.29 after an attempted breakout would weaken this scenario and indicate that resistance has not been decisively cleared. A probability percentage is not determinable from the supplied report.
Bearish scenario
If price rejects the area between 81426.29 and 82844.58, the firm weekly and daily downtrends remain the controlling framework. A retracement would bring the broken-retest area at 59783.75–62793.85 and the broader weekly support at 59783.75–69241.82 into focus. A sustained move above 82844.58 would invalidate this rejection scenario. A probability percentage is not determinable from the supplied report.
Range or failed-breakout scenario
BTCUSD may continue to oscillate between the current recovery area and the resistance band if neither side achieves confirmation. In that case, the interaction with 77464.66, the listed 0.786 Fibonacci level, can help distinguish continued recovery from renewed weakness. A decisive move beyond 81426.29–82844.58 or a breakdown toward 59783.75–62793.85 would invalidate the range interpretation. A probability percentage is not determinable from the supplied report.
Closing assessment
The daily recovery is constructive in the short-term structure but remains counter to the firm weekly and daily main trends. The most important test is whether price can secure acceptance above 81426.29–82844.58; rejection there would keep the bearish framework active, while a confirmed break would open the path toward the higher weekly resistance at 94666.07–97971.19. No news or economic-calendar context was supplied with the report.
Technical analysis is provided for reference only and is not investment advice. Markets carry risk, and readers are responsible for their own decisions.
#BTCUSD #Bitcoin #TechnicalAnalysis #PriceAction #MarketOutlook
Meta description: BTCUSD daily analysis: recovery approaches 81426.29–82844.58 resistance while weekly and daily trends remain firmly down.