
BTCUSD is trading at a tension point between a firm daily downtrend and a rising short-term sub-trend. The latest closed daily price is 77735.04, while the weekly close is 77057.88. Price has recovered from the broader support structure, but the move is now approaching the daily resistance zone at 81426.29–82844.58 and the weekly broken-retest resistance at 76590.80–80761.73.
| Metric | Value |
|---|---|
| Daily last closed price | 77735.04 |
| Weekly last closed price | 77057.88 |
| Weekly trend | Sideways, with an up sub-trend |
| Daily trend | Down, with an up sub-trend |
| Nearest daily resistance | 81426.29–82844.58 |
| Nearest daily support | 59783.75–62793.85 broken-retest zone |
| Active Fibonacci ratio | 0.797, near 0.786 at 77464.66 |
Higher-timeframe context
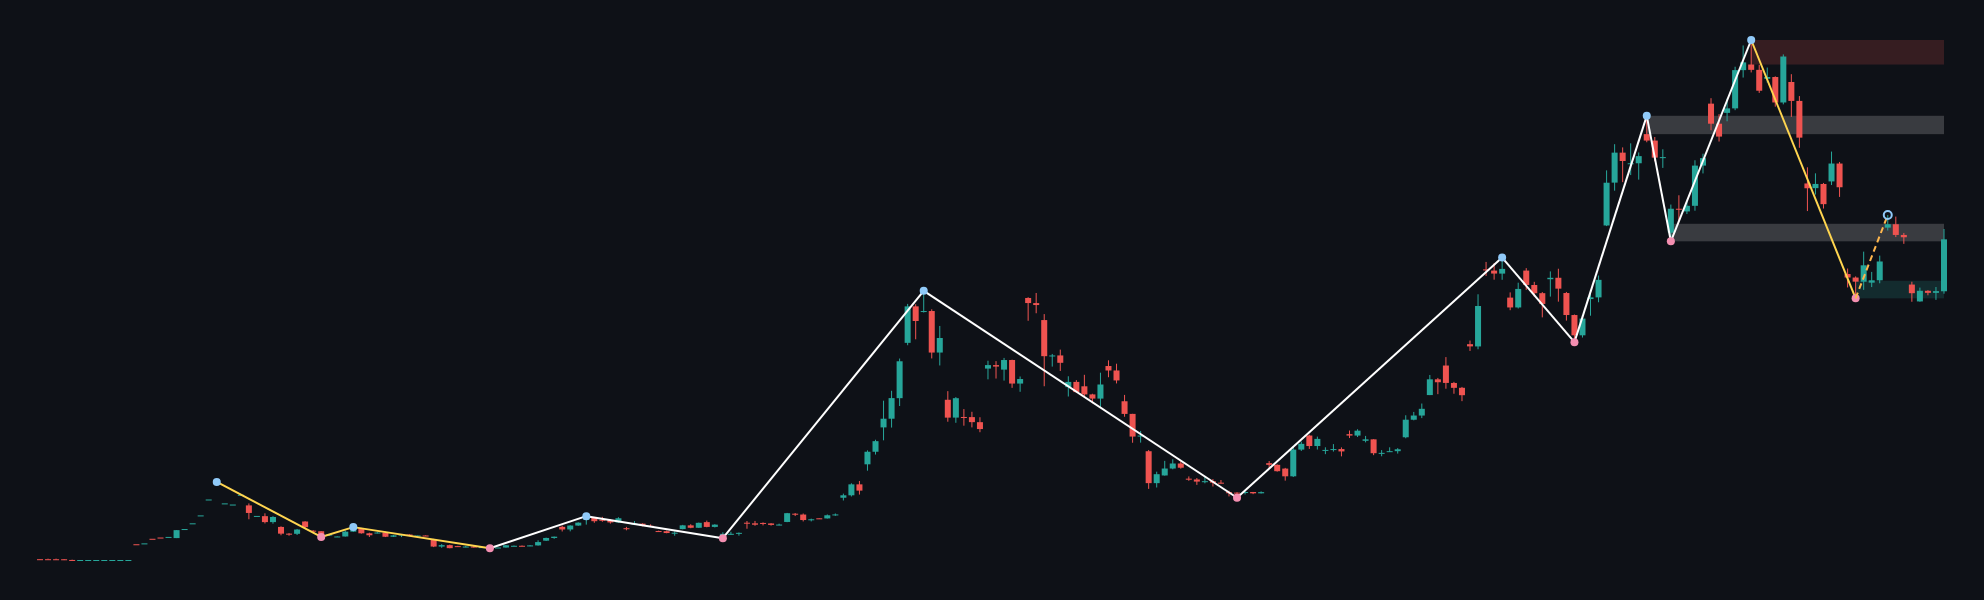
The weekly structure is classified as sideways and firm, while its sub-trend is up. No weekly structure event is recorded, so the broader chart does not yet confirm a decisive structural breakout or breakdown. The most recent confirmed weekly swing is a low at 63006.33.
At the upper side of the weekly framework, the resistance zone at 118723.58–124563.72 remains a distant supply area. Closer to current price, the broken-retest resistance zone at 76590.80–80761.73 is important because the weekly close at 77057.88 is inside that region. A sustained move above the zone would improve the broader bullish case, while rejection from it would preserve the range interpretation.
Below the market, the weekly support zone at 63006.33–67177.26 is the principal broader demand area. The zone at 102132.77–106494.31 is also marked as a broken-retest support area, although it is positioned above the current market and therefore functions as historical structure rather than nearby support. Weekly ATR is 8341.85, indicating that the larger timeframe can accommodate wide swings between these regions.
The weekly chart therefore permits further upside while price holds above the broader support structure, but it does not remove the risk of rejection inside 76590.80–80761.73. The higher-timeframe bias is better described as range-bound with an upward sub-trend than as a confirmed bullish trend.
Main-frame structure
The daily main trend is down and firm, while the sub-trend is up. This is a clear timeframe disagreement: the current advance can be treated as a counter-trend recovery unless price establishes itself above the daily resistance structure. No daily structure event is recorded, and the most recent confirmed daily swing is a low at 57704.79.
The daily resistance zone at 81426.29–82844.58 is the main test above current price. The lower support zone at 57704.79–58823.75 is the principal downside reference. The broken-retest resistance zone at 59783.75–62793.85 is below current price and may become relevant if the recovery fails.
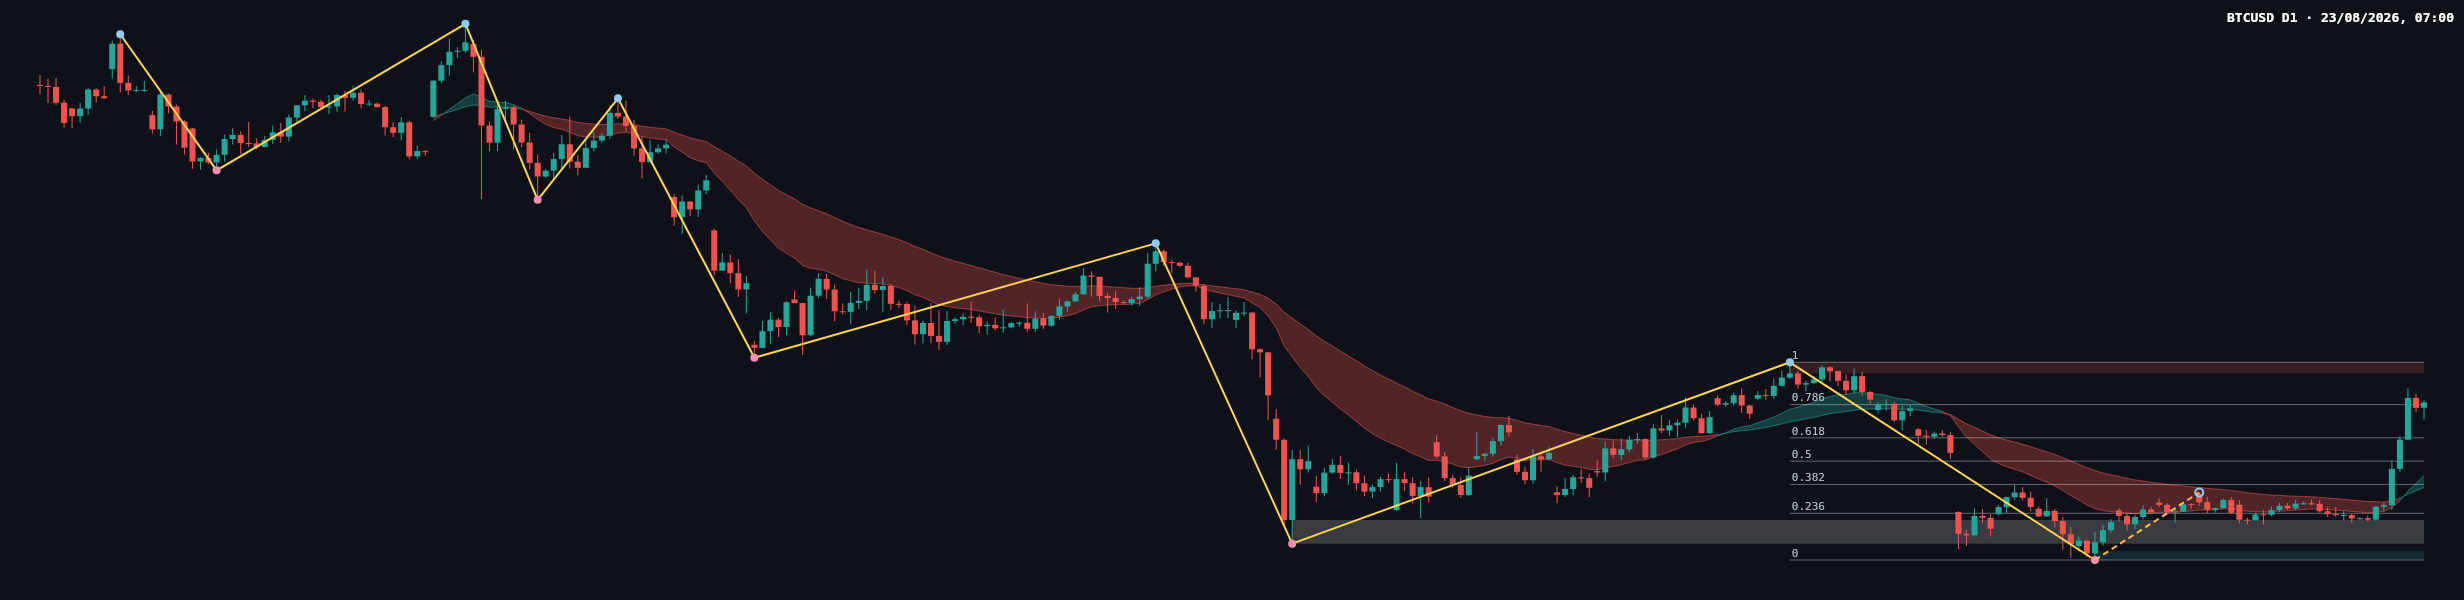
The completed daily Dow leg runs from 57704.79 at ratio 0 to 82844.58 at ratio 1. Its intermediate levels are 63637.78 at 0.236, 67308.19 at 0.382, 70274.69 at 0.5, 73241.18 at 0.618, and 77464.66 at 0.786. The current retracement ratio is 0.797, placing price just above the 0.786 reference and close to the upper boundary of the retracement structure.
Key levels and recent price action
The latest recovery has carried price back toward 77464.66 and into the weekly broken-retest zone at 76590.80–80761.73. That location is important because it places the daily recovery against overhead historical resistance while the daily trend remains down.
The chart shows a prolonged decline into the daily low at 57704.79, followed by a base and a gradual recovery. More recently, price moved sideways around the lower daily structure before accelerating upward into the current area. The latest visible candles show a strong upward displacement followed by smaller candles near the closing price, suggesting that buying pressure has reached a level where sellers may begin testing the advance.
Exact candle classifications, individual candle ranges, volume readings, and EMA values are not provided in the deterministic report. Accordingly, the precise body-to-wick comparison, volume confirmation, EMA spacing, slope, and crossover status are not determinable from the permitted data. The chart does, however, support a conditional interpretation: the recovery is constructive above the lower Fibonacci levels, but it remains vulnerable to rejection while below 81426.29–82844.58.
Scenarios
Bullish continuation scenario
If price breaks and holds above 81426.29–82844.58, the daily recovery would challenge the current firm downtrend and could open a path toward the weekly resistance zone at 118723.58–124563.72. The bullish interpretation would be invalidated if price returns below 81426.29–82844.58 after the attempted break. No probability estimate is assigned because the report provides no statistical probability model.
Range and rejection scenario
If price remains inside or is rejected from the weekly broken-retest zone at 76590.80–80761.73, the market may continue to trade as a range while the daily downtrend remains intact. A return below 77464.66 would weaken the immediate recovery and refocus attention on 73241.18 and 70274.69. This scenario is invalidated by sustained acceptance above 81426.29–82844.58. No probability estimate is assigned.
Bearish continuation scenario
If sellers drive price below 73241.18, the daily recovery would have given back a significant portion of its retracement and the lower Fibonacci references would become relevant. The first broader downside area is the weekly support zone at 63006.33–67177.26, followed by the daily support zone at 57704.79–58823.75. The bearish scenario would be invalidated by a sustained move above 81426.29–82844.58. No probability estimate is assigned.
What matters next
- Resistance: monitor 76590.80–80761.73 as the nearer weekly decision area and 81426.29–82844.58 as the principal daily ceiling.
- Support: monitor 77464.66, 73241.18, and 70274.69 as Fibonacci references, followed by 63006.33–67177.26 and 57704.79–58823.75.
- Confirmation: a close above 82844.58 would provide stronger evidence that the daily recovery is overcoming resistance. A close below 73241.18 would instead favor renewed downside pressure.
- Traps: a brief move above 81426.29–82844.58 followed by a return below the zone would represent a failed breakout. Conversely, a temporary dip toward 73241.18 that quickly recovers would warn against treating every support test as a confirmed breakdown.
- Volatility: daily ATR is 2237.93, while weekly ATR is 8341.85. These figures underline the need to distinguish a temporary level breach from sustained acceptance.
Closing view
BTCUSD is at a pivotal area: the daily sub-trend is up, but the main daily trend remains down and price is pressing into resistance. Above 81426.29–82844.58, the recovery would gain structural significance; below 73241.18, the balance would shift back toward the lower Fibonacci and support zones. Until one of those conditions develops, the market remains vulnerable to two-way movement around the weekly broken-retest area.
This article is technical analysis and reference information only, not investment advice. Markets carry risk, and readers are responsible for their own decisions.