
BTCUSD presents a mixed multi-timeframe picture. The weekly context remains sideways, with the latest closed price at 63020.22 inside the weekly support zone at 62409.68 – 67488.06. On the daily frame, the latest closed price is 69288.63, above the resistance zone at 66281.39 – 67264.32 after a change of character at 67264.32. The key question is whether this move can hold above the broken level or return into the prior range.
Higher-timeframe context
The weekly main trend is sideways and firm, with the sub-trend also sideways. No weekly structure event is recorded, so the broader chart does not yet confirm a sustained directional transition. The most recent confirmed weekly swing is a low at 62409.68.
Price is positioned around the weekly support area at 62409.68 – 67488.06, while the larger resistance zone is at 118374.30 – 124563.72. A broken-retest support zone is listed at 104703.29 – 109879.73, and a broken-retest resistance zone is listed at 74471.48 – 79173.64. The weekly ATR is 7477.78, indicating that the wider frame allows for meaningful movement around these zones.
The weekly report does not provide a Fibonacci interaction for the current context, nor does it provide weekly EMA values. Those elements are therefore not determinable from the supplied data.
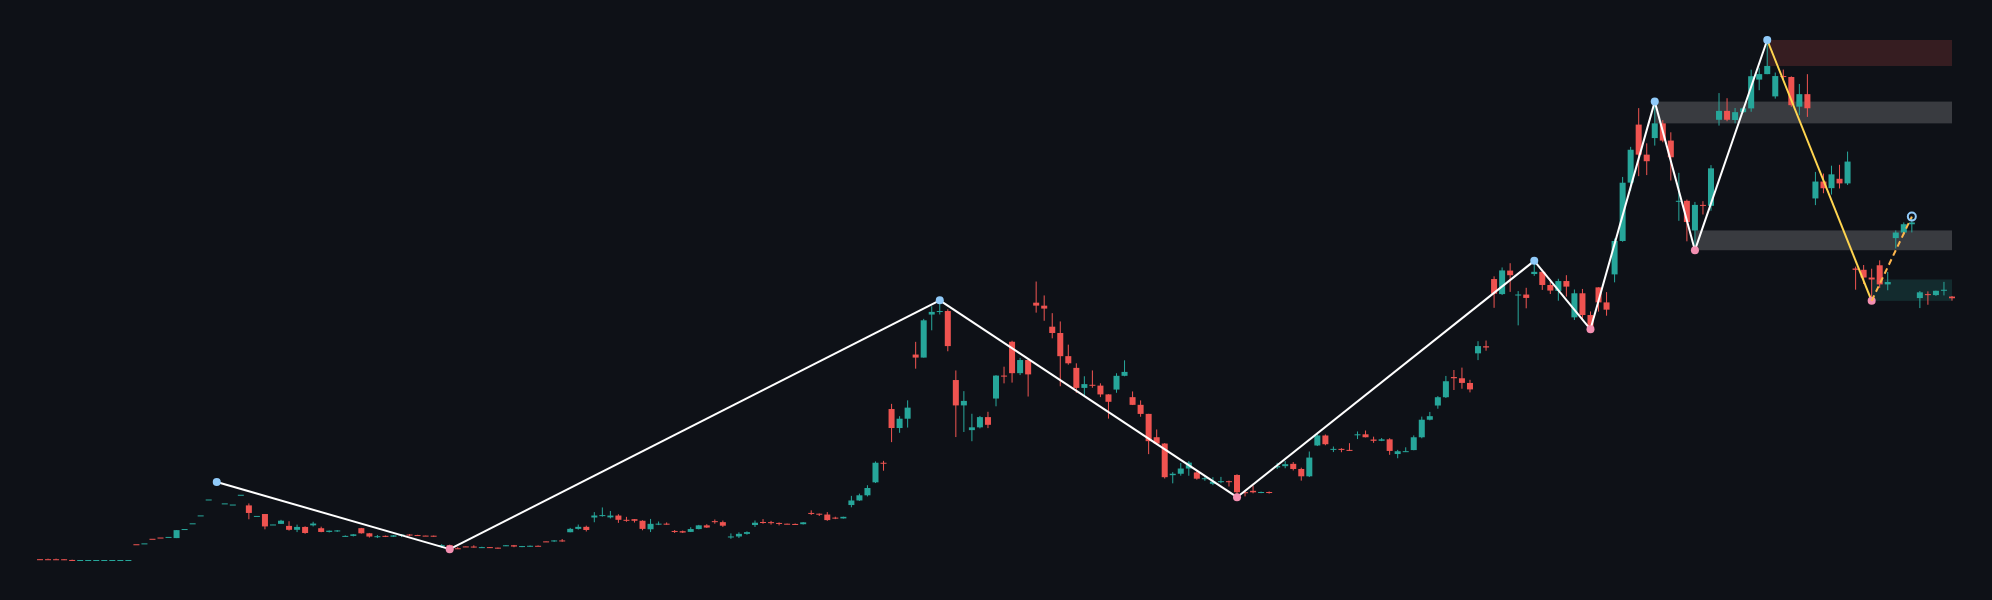
Main-frame structure
The daily main trend is down and shaky, while the sub-trend is up. This creates a clear disagreement with the weekly sideways backdrop: the current advance may represent an early reversal signal on the daily chart, but it still requires acceptance above the broken structure level.
The recorded daily structure event is a CHoCH at 67264.32. The latest confirmed daily swing low is 57704.79. The main-frame resistance zone is 66281.39 – 67264.32, while the nearest listed support zone is 57704.79 – 58541.32. A broken-retest resistance zone is located at 59472.70 – 60849.22.
The latest completed Dow leg runs from 57704.79 to 67264.32. Its Fibonacci levels are 59960.84 at 0.236, 61356.53 at 0.382, 62484.56 at 0.5, 63612.58 at 0.618, and 65218.58 at 0.786. The current retracement ratio is 1.000, placing the daily market at the completed leg's upper boundary.
The daily ATR is 1657.43. The supplied report does not include numerical EMA values, volume readings, or momentum readings, so those features are not determinable from the data.
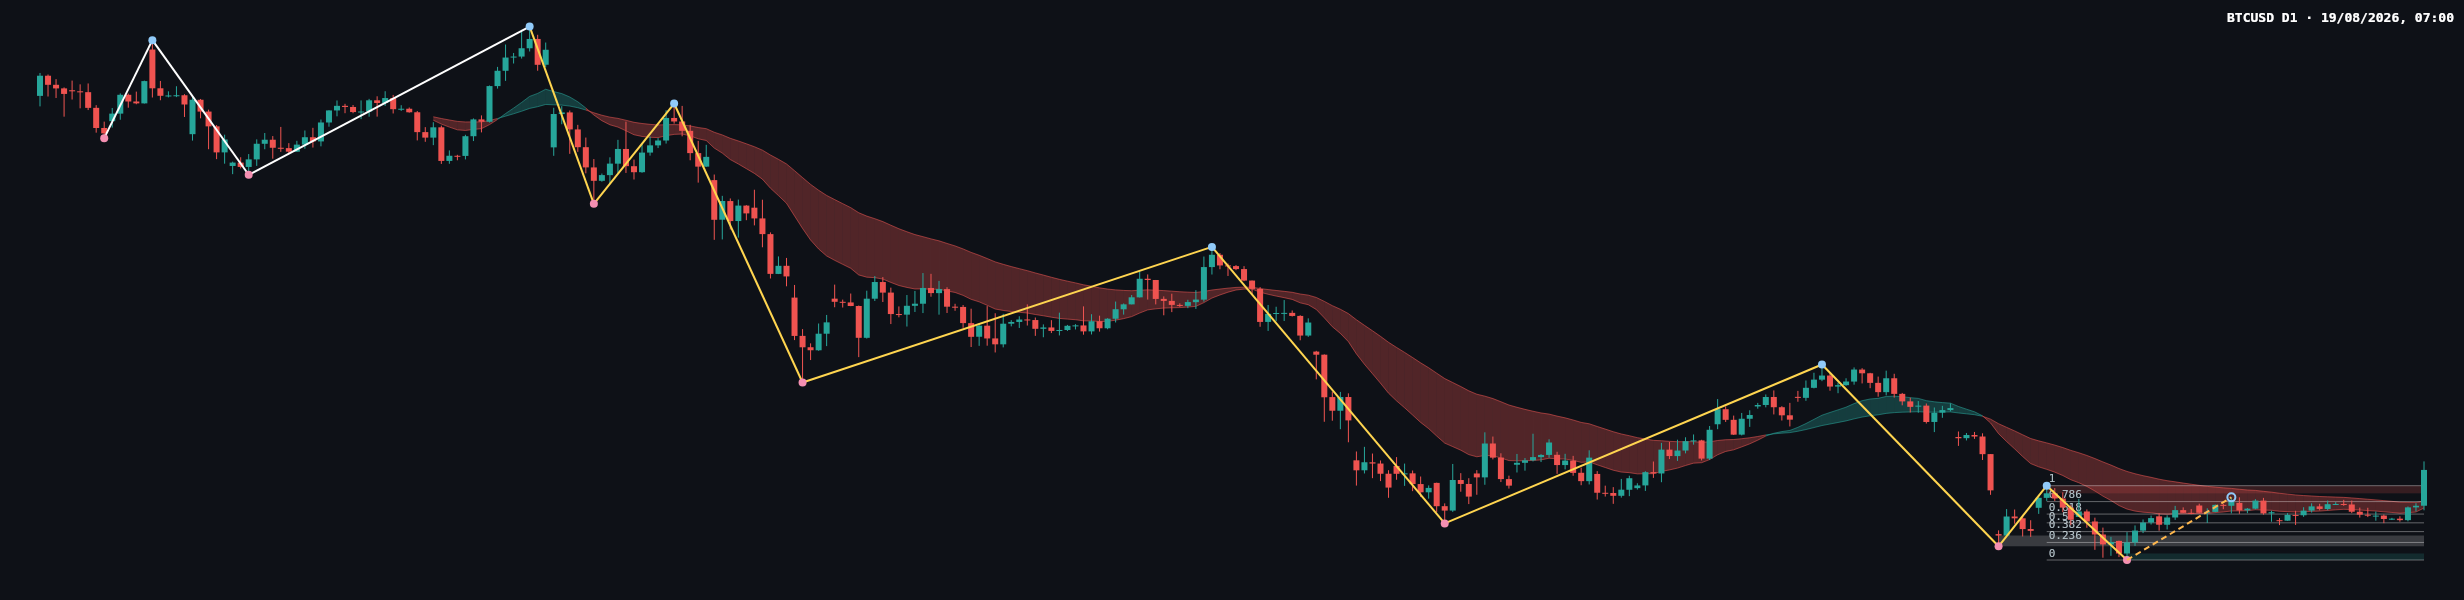
Key levels and the latest candle
- 69288.63: latest closed daily price.
- 66281.39 – 67264.32: daily resistance zone and the area surrounding the CHoCH level.
- 65218.58, 63612.58, 62484.56, 61356.53, and 59960.84: Fibonacci reference levels.
- 59472.70 – 60849.22: broken-retest resistance zone that may become relevant if price moves back through the daily range.
- 57704.79 – 58541.32: primary listed daily support zone.
- 62409.68 – 67488.06: weekly support zone, which overlaps the broader daily structure area.
The latest visible daily candle is bullish and extends above the daily resistance zone. Its practical significance depends on whether subsequent candles remain above 67264.32. Without the candle's exact open, high, low, and close components beyond the reported closing price, a precise classification such as a pin bar, engulfing candle, or marubozu is not determinable from the supplied data.
Compared with the recent decline visible on the worker chart, the latest candle represents an attempt by buyers to regain control. However, the daily main trend remains down and shaky, so the move is better treated as a conditional structural improvement than as a confirmed long-term reversal.
Scenarios
Bullish continuation scenario
If BTCUSD holds above 67264.32 and the former resistance zone at 66281.39 – 67264.32 acts as support, the daily CHoCH would receive stronger confirmation. The next relevant upside reference is the weekly broken-retest resistance zone at 74471.48 – 79173.64. This scenario is invalidated if price decisively returns below 66281.39 and fails to reclaim the zone.
Range and retest scenario
If price remains near the boundary between 66281.39 and 67264.32 without sustained acceptance above it, BTCUSD may consolidate between the recent daily recovery area and the Fibonacci references at 65218.58 and 63612.58. This scenario is invalidated by a clear continuation above the resistance area or a decisive move below 63612.58.
Bearish rejection scenario
If the move above 67264.32 fails and sellers push price back below the daily resistance zone, the broken-retest area at 59472.70 – 60849.22 becomes a relevant downside reference. A deeper bearish development would bring the support zone at 57704.79 – 58541.32 into focus. This scenario is invalidated if price holds above 67264.32 and develops fresh daily structure above the zone.
No scenario probabilities are assigned because the deterministic report does not provide probability estimates. The daily bias leans cautiously upward while price remains above 67264.32, but the weekly sideways structure argues for confirmation and flexibility.
Session considerations
- Watch the interaction between 66281.39 – 67264.32 and the current price at 69288.63.
- Monitor whether 65218.58 and 63612.58 act as intermediate Fibonacci references during a pullback.
- A sustained daily close above 67264.32 would strengthen the bullish interpretation; rejection back below the zone would weaken it.
- False breaks and liquidity sweeps around the former resistance area remain possible, particularly while the weekly trend is sideways.
- The report contains no scheduled-news information. Traders should independently check the economic calendar and major macroeconomic or geopolitical headlines.
This analysis describes market structure rather than an order plan. Any decision should account for volatility, the daily ATR of 1657.43, and the possibility that price invalidates the initial interpretation.
Summary
- The weekly structure is sideways, with support at 62409.68 – 67488.06.
- The daily trend is down and shaky, but the sub-trend is up after a CHoCH at 67264.32.
- The latest daily close at 69288.63 is above the daily resistance zone at 66281.39 – 67264.32.
- Holding above 67264.32 supports a continuation interpretation, while rejection brings the Fibonacci and lower support references back into focus.
The single most important consideration is whether BTCUSD can maintain acceptance above 67264.32 rather than merely trade above it briefly.
#BTCUSD #Bitcoin #TechnicalAnalysis #PriceAction #DowTheory
Meta description: BTCUSD daily analysis: price is above 67264.32 after a CHoCH, while weekly structure remains sideways around key support and resistance zones.
This article is technical analysis and reference information only, not investment advice. Markets carry risk, and readers are responsible for their own decisions.