
BTCUSD đóng cửa ở mức 62832.88 trên khung daily, cao hơn một chút so với vùng resistance broken-retest 59783.75 – 62793.85 và nằm trong vùng support weekly rộng hơn tại 62409.68 – 67488.06. Thị trường trên khung thời gian lớn đang đi ngang, trong khi xu hướng daily vẫn giảm với sub-trend tăng. Đặc điểm đáng chú ý nhất là sự co hẹp quanh các mức giá gần nhau thay vì một structure break đã được xác nhận.
Bối cảnh khung thời gian lớn — Weekly
Xu hướng weekly được phân loại là đi ngang, với sub-trend đi ngang rõ rệt và chưa có sự kiện cấu trúc nào được xác nhận. Swing weekly được xác nhận gần nhất là một đáy tại 62409.68, đặt thị trường hiện tại gần một vùng demand quan trọng trên khung thời gian lớn. ATR weekly là 7477.78, cho thấy biên độ rộng hơn vẫn lớn đáng kể so với vùng tích lũy daily hiện tại.
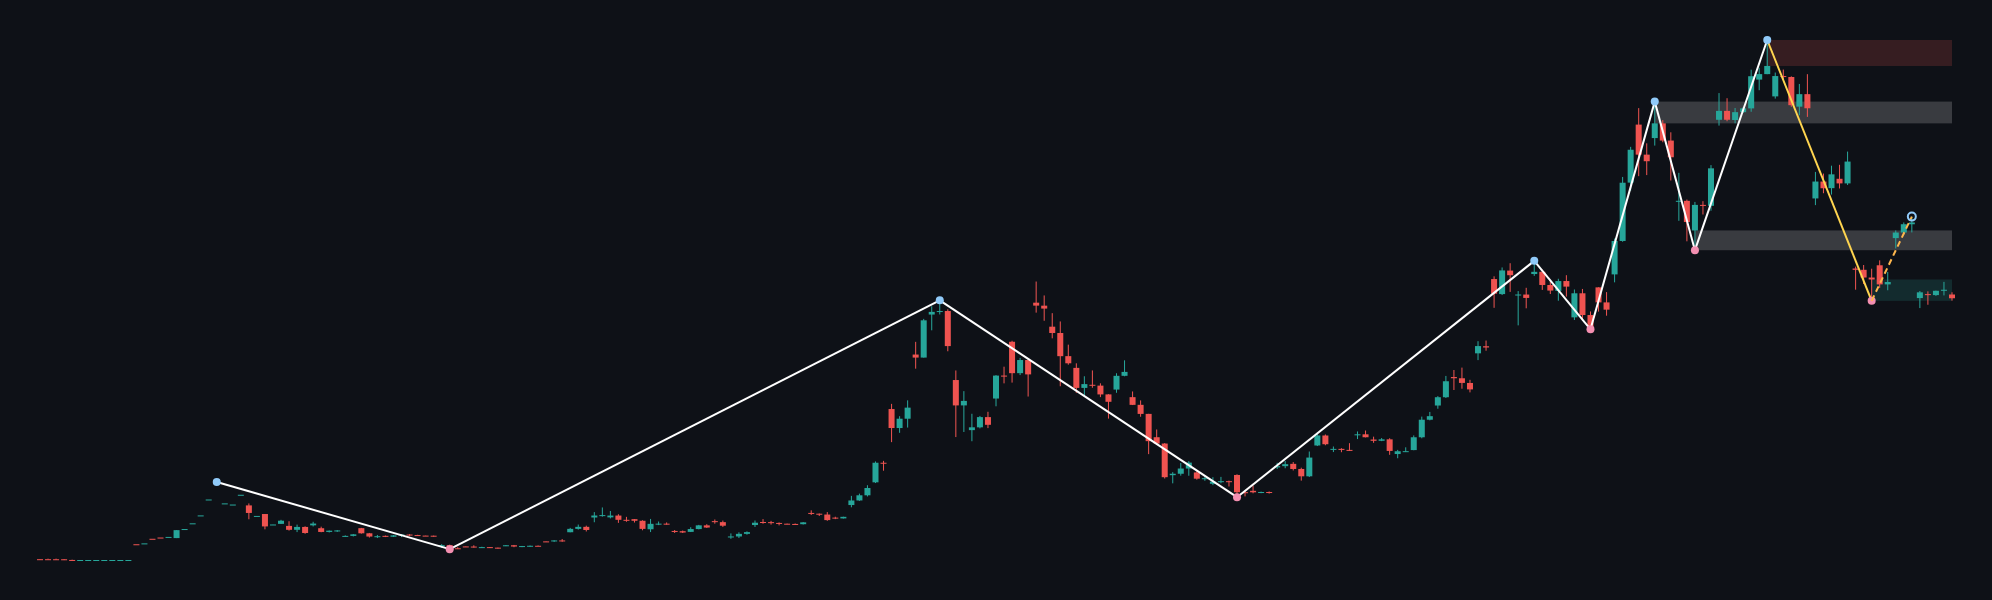
Vùng support weekly chính là 62409.68 – 67488.06. Vùng support broken-retest sâu hơn nằm tại 104703.29 – 109879.73, trong khi vùng resistance chính là 118374.30 – 124563.72. Một vùng resistance broken-retest khác được đánh dấu tại 74471.48 – 79173.64. Với giá weekly đóng cửa gần nhất là 63020.22, thị trường đang nằm gần biên dưới của vùng support weekly thay vì ở vùng trống.
Các giá trị moving average weekly và mối quan hệ chính xác của chúng với giá không thể xác định từ báo cáo dữ liệu được cung cấp. Các giá trị Fibonacci weekly cũng không được cung cấp. Vì vậy, tham chiếu đáng tin cậy trên khung thời gian lớn là vùng support weekly, vùng resistance broken-retest và đáy đã được xác nhận tại 62409.68.
Cấu trúc khung chính — Daily
Xu hướng chính daily là giảm và rõ rệt, trong khi sub-trend là tăng. Đây là sự lệch pha với trạng thái đi ngang của weekly và nên được xem là một đợt phục hồi ngược xu hướng bên trong xu hướng giảm daily rộng hơn cho đến khi giá thiết lập một thay đổi cấu trúc được xác nhận. Không có sự kiện cấu trúc daily nào được ghi nhận.
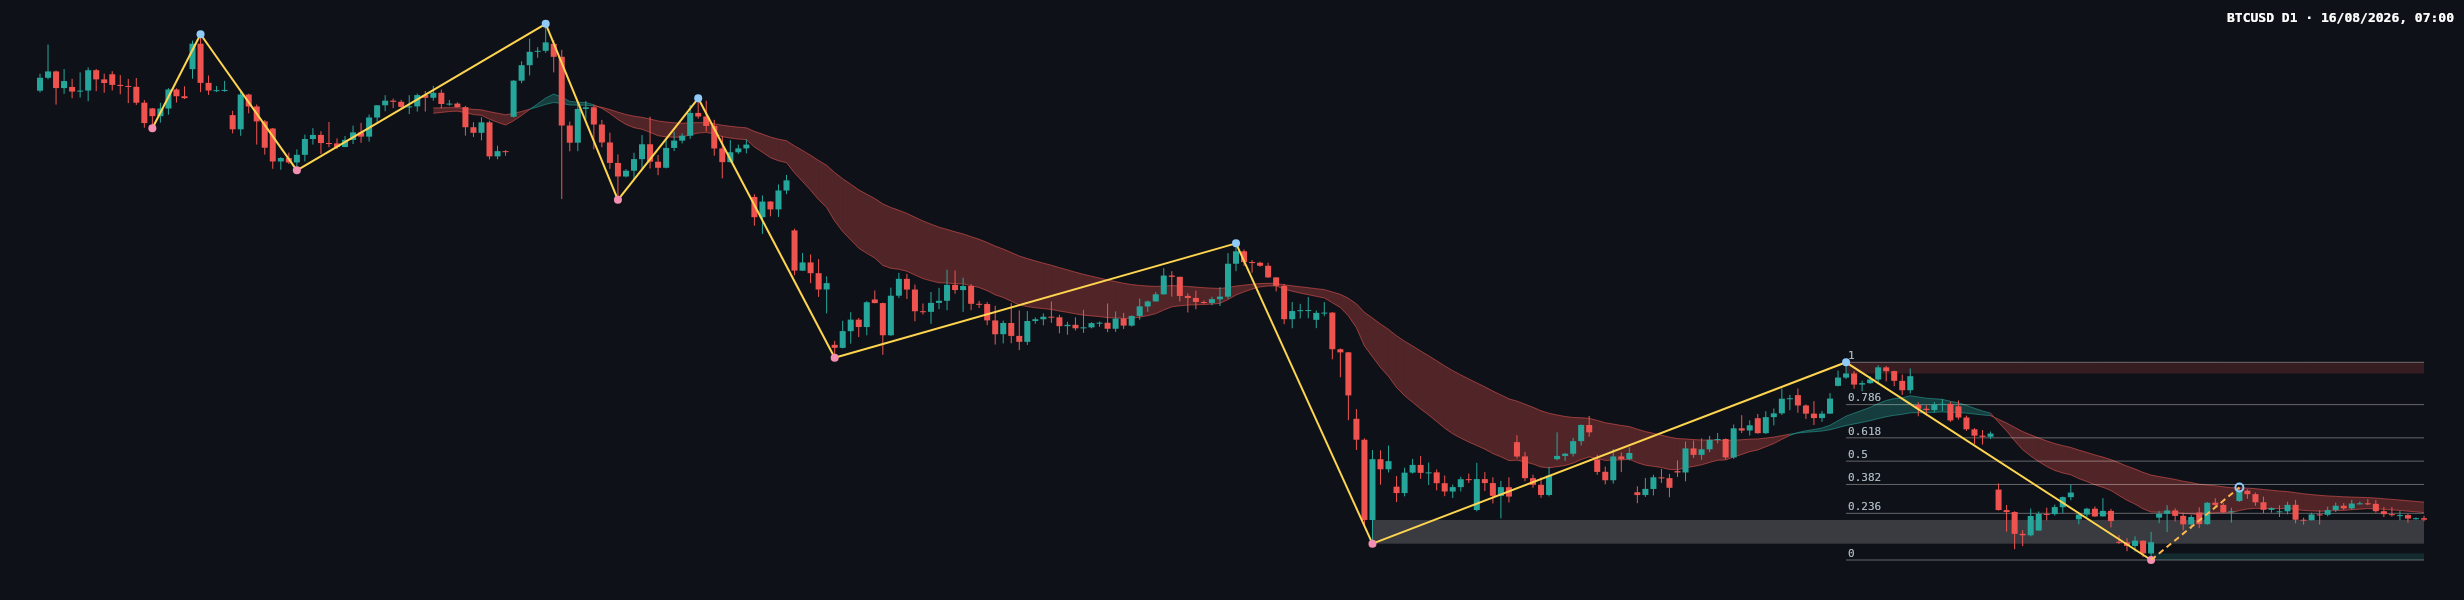
Nhịp Dow hoàn tất gần nhất chạy từ 57704.79 đến 82844.58. Các mức Fibonacci của nhịp này là 0.236 tại 63637.78, 0.382 tại 67308.19, 0.5 tại 70274.69, 0.618 tại 73241.18 và 0.786 tại 77464.66. Tỷ lệ retracement hiện tại là 0.204, đưa giá xuống dưới mức retracement 0.236 tại 63637.78. Điều này cho thấy đà phục hồi cho đến nay vẫn nông về mặt kỹ thuật.
Resistance daily được xác định bởi 81426.29 – 82844.58, trong khi vùng resistance broken-retest gần hơn là 59783.75 – 62793.85. Support daily là 57704.79 – 58541.32. ATR daily là 1341.02. Các giá trị chính xác của EMA20 và EMA50 không thể xác định từ báo cáo, vì vậy khoảng cách, độ dốc và trạng thái giao cắt chính xác của chúng không thể được xác nhận bằng số liệu.
Đọc nến gần đây và momentum
Các nến gần nhất trên biểu đồ worker cho thấy thân nến tương đối nhỏ và hướng đi đan xen quanh phần thấp của biên độ gần đây. Sự tập trung của chúng cho thấy sự do dự sau đà giảm thay vì sự mở rộng quyết đoán từ một trong hai phía. Giá đóng cửa gần nhất tại 62832.88 chỉ cao hơn biên trên của vùng broken-retest daily ở 62793.85, nhưng vẫn nằm dưới tham chiếu Fibonacci đầu tiên tại 63637.78.
Do đó, chuỗi nến thể hiện bức tranh giằng co giữa bên mua và bên bán. Bên mua đã giữ được thị trường trên vùng support daily tại 57704.79 – 58541.32, trong khi bên bán vẫn có khả năng bảo vệ khu vực quanh 63637.78 và vùng resistance daily rộng hơn tại 81426.29 – 82844.58. Một phân loại nến chính xác, chẳng hạn như pin bar hoặc nến Engulfing, không được cung cấp trong báo cáo xác định và không nên được xem là đã xác nhận.
Các chỉ số volume và momentum không được đưa vào báo cáo. Do đó, không có xác nhận volume bằng số liệu hoặc tín hiệu phân kỳ nào để sử dụng. Tỷ lệ retracement hiện tại là 0.204, đây là chỉ báo rõ ràng nhất hiện có cho thấy đà phục hồi vẫn hạn chế so với nhịp Dow đã hoàn tất.
Các mức quan trọng
- 62832.88: giá daily đóng cửa gần nhất.
- 62793.85: biên trên của vùng resistance broken-retest daily.
- 59783.75 – 62793.85: vùng broken-retest daily, nơi việc chấp nhận hoặc từ chối giá có thể làm rõ hướng đi.
- 63637.78: mức Fibonacci daily 0.236 và tham chiếu phục hồi tiếp theo phía trên giá hiện tại.
- 62409.68 – 67488.06: vùng support weekly.
- 57704.79 – 58541.32: vùng support daily và khu vực quanh đáy daily được xác nhận gần nhất.
- 67308.19, 70274.69, 73241.18 và 77464.66: các tham chiếu retracement Fibonacci cao hơn.
- 81426.29 – 82844.58: vùng resistance daily chính và điểm cuối phía trên của nhịp Fibonacci đã hoàn tất.
Các kịch bản có điều kiện
Kịch bản phục hồi tăng
Nếu giá duy trì giao dịch trên 62793.85 và sau đó vượt qua 63637.78, đà phục hồi có thể kéo dài hướng tới tham chiếu Fibonacci tiếp theo tại 67308.19. Một đợt tăng vào vùng support weekly tại 62409.68 – 67488.06 vẫn sẽ thể hiện việc kiểm tra resistance chứ tự nó chưa phải là một sự đảo chiều daily đã được xác nhận. Kịch bản này sẽ mất hiệu lực nếu giá dứt khoát quay xuống dưới 62793.85, sau đó được chấp nhận trở lại bên trong vùng broken-retest.
Kịch bản tiếp diễn giảm
Nếu giá không thể giữ trên 62793.85 và bên bán giành lại quyền kiểm soát vùng 59783.75 – 62793.85, sự chú ý sẽ quay lại vùng support weekly tại 62409.68 – 67488.06 và sau đó là support daily tại 57704.79 – 58541.32. Một đợt di chuyển duy trì dưới 57704.79 sẽ tiếp tục làm suy yếu cấu trúc support hiện tại. Kịch bản giảm sẽ bị thách thức nếu giá giành lại 63637.78 và giữ được phía trên mức này.
Kịch bản đi ngang và phá vỡ thất bại
Giá có thể tiếp tục dao động giữa vùng broken-retest gần đó và tham chiếu Fibonacci tại 63637.78 mà không tạo ra sự kiện cấu trúc được xác nhận. Trong trường hợp này, một cú phá vỡ ngắn theo một trong hai hướng có thể thất bại và đưa giá trở lại vùng tích lũy. Cách diễn giải đi ngang sẽ suy yếu nếu giá được chấp nhận duy trì trên 63637.78 hoặc mất dứt khoát 59783.75.
Cần theo dõi
- Liệu 62793.85 sẽ đóng vai trò support được giành lại hay resistance mới hình thành.
- Liệu bên mua có thể thiết lập sự chấp nhận phía trên 63637.78.
- Liệu bên bán có thể đẩy giá trở lại xuyên qua 59783.75.
- Liệu vùng support weekly tại 62409.68 – 67488.06 có tiếp tục giữ thị trường bên trong vùng này hay không.
- Liệu một sự kiện cấu trúc daily mới được xác nhận có xuất hiện hay không; hiện chưa có sự kiện nào được ghi nhận.
Không có bối cảnh tin tức hoặc lịch kinh tế nào được cung cấp cùng với dữ liệu thị trường. Các trader theo dõi thiết lập này nên tính đến biến động do sự kiện và tránh xem một chuyển động intraday đơn lẻ xuyên qua một mức giá là sự xác nhận. Các nguyên tắc quản trị rủi ro chung vẫn phù hợp, bao gồm mức độ tiếp xúc được đo lường, nhận thức về biến động và tránh đưa ra quyết định chỉ dựa trên một cú breakout giả hoặc liquidity sweep.
Tóm tắt
- Cấu trúc weekly đi ngang, với đáy được xác nhận gần nhất tại 62409.68.
- Xu hướng daily giảm, mặc dù sub-trend đang tăng.
- Giá daily đóng cửa gần nhất tại 62832.88, ngay phía trên 59783.75 – 62793.85.
- Tham chiếu phục hồi Fibonacci đầu tiên là 63637.78, trong khi support sâu hơn là 57704.79 – 58541.32.
- Câu hỏi then chốt là liệu giá có thể giữ trên 62793.85 và vượt qua 63637.78, hay quay trở lại vùng broken-retest.
Điều quan trọng nhất cần xem xét là phản ứng của thị trường quanh 62793.85 và 63637.78.
Phân tích kỹ thuật BTCUSD, dựa trên dữ liệu weekly và daily được cung cấp, cho thấy một thị trường có điều kiện với chưa có structure break nào được xác nhận. Định hướng vẫn thận trọng cho đến khi giá thiết lập sự chấp nhận phía trên tham chiếu Fibonacci gần đó hoặc mất các vùng support được đánh dấu.
#BTCUSD #Bitcoin #TechnicalAnalysis #PriceAction #CryptoMarkets
Mô tả meta: BTCUSD vẫn trong xu hướng giảm daily mạnh và biên độ weekly khi giá kiểm tra vùng broken-retest 59783.75–62793.85.
Bài viết này là phân tích kỹ thuật chỉ nhằm mục đích tham khảo và không phải là lời khuyên đầu tư. Thị trường luôn có rủi ro, và độc giả chịu trách nhiệm cho các quyết định của riêng mình.