
XAU/USD closed at 4679.801 on the Daily chart, above the latest completed Fibonacci leg and above the broken daily structure level at 4382.441. The higher-timeframe picture remains constructive, but the weekly sub-trend is down and price is still below the major weekly resistance zone at 5019.871–5595.362. This leaves the market at an important transition point: daily recovery versus broader resistance.
| Metric | Reading |
|---|---|
| Most recent close | 4679.801 |
| Weekly trend | Up, firm; sub-trend down |
| Daily trend | Down, shaky; sub-trend up |
| Daily structure event | CHoCH at 4382.441 |
| Nearest documented daily resistance | 4331.294–4382.441 |
| Daily support zone | 3942.138–4005.629 |
| Active Fibonacci reading | 1.000 at 4382.441 |
| Daily bias | Recovery within a broader transition |
Higher-timeframe context
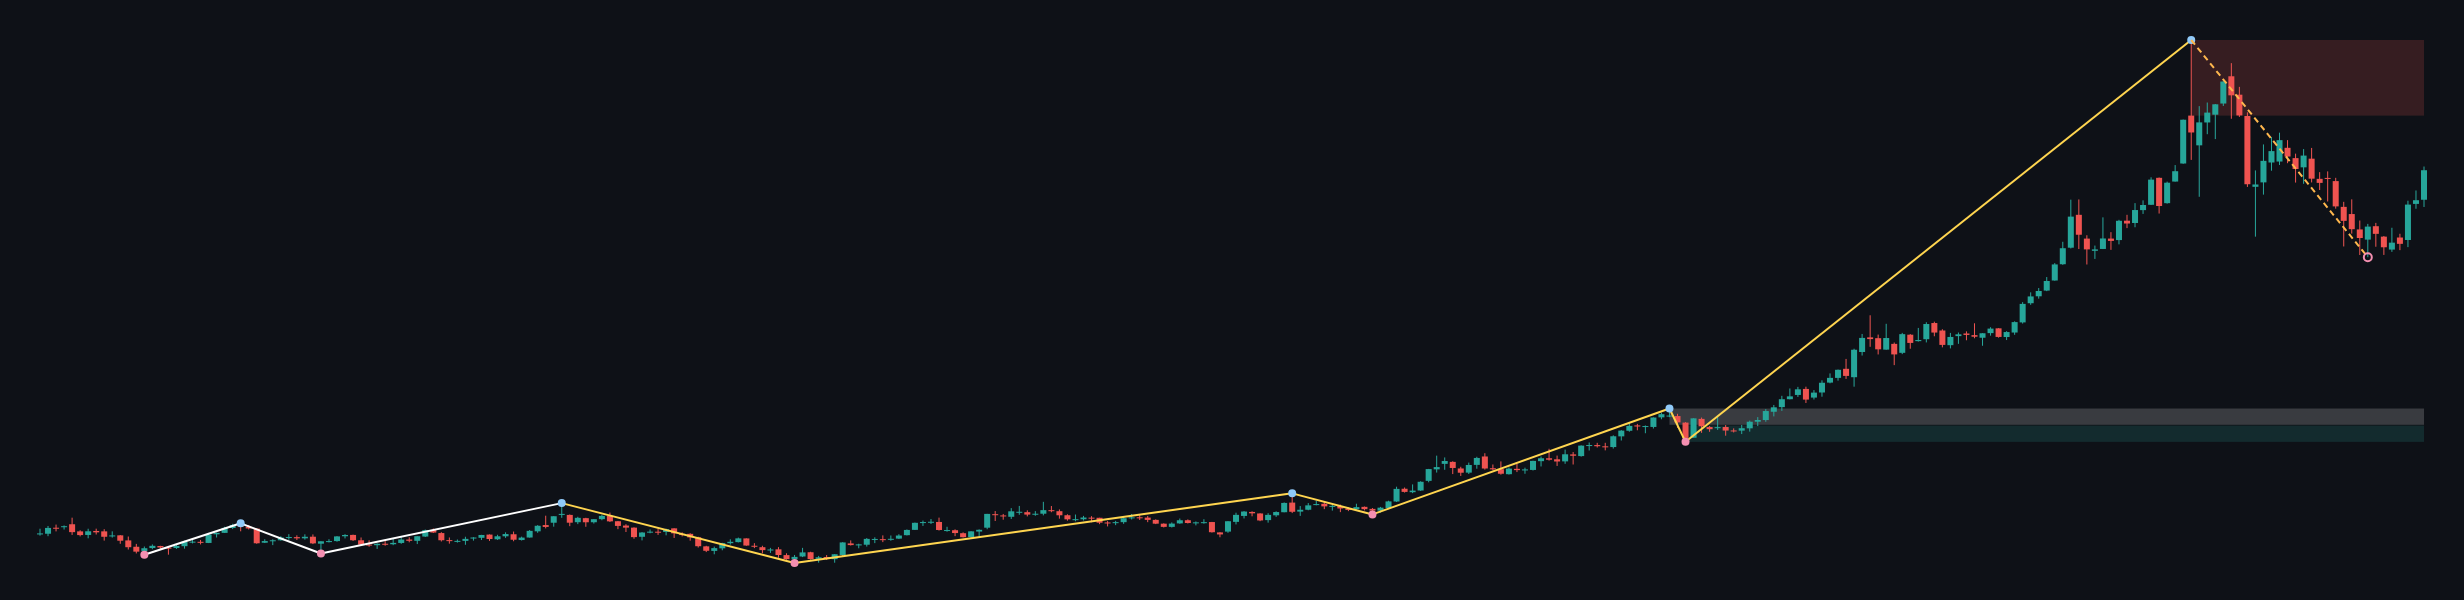
The weekly chart shows a firm uptrend, with the most recent confirmed swing high at 5595.362. No weekly structure event is recorded, so the broader upward structure has not been formally invalidated. At the same time, the weekly sub-trend is down, indicating that the market is correcting within the larger advance rather than moving in a uniformly one-directional fashion.
The last closed weekly price is 4604.083. The major weekly resistance zone is 5019.871–5595.362, while the principal weekly support zone is 2536.779–2660.238. A second area, 2666.640–2790.099, is marked as a broken-retest zone. The report does not provide the numerical distance from the current price to these zones, so that distance is not determinable from the supplied data.
Price is below the weekly resistance zone and remains well above the documented weekly support areas. The weekly chart therefore permits continued recovery toward resistance, but it does not confirm that the larger correction has ended. A sustained move into 5019.871–5595.362 would place price into a major supply area where the weekly sub-trend could again become decisive.
The weekly chart does not include a separate Fibonacci reading in the deterministic report. Any weekly Fibonacci interaction is therefore not determinable from the supplied data.
Main-frame structure
The Daily chart records a down main trend that is described as shaky, alongside an upward sub-trend. This is not fully aligned with the weekly uptrend: the weekly framework is constructive, while the Daily chart is still classified as down despite its recent recovery.
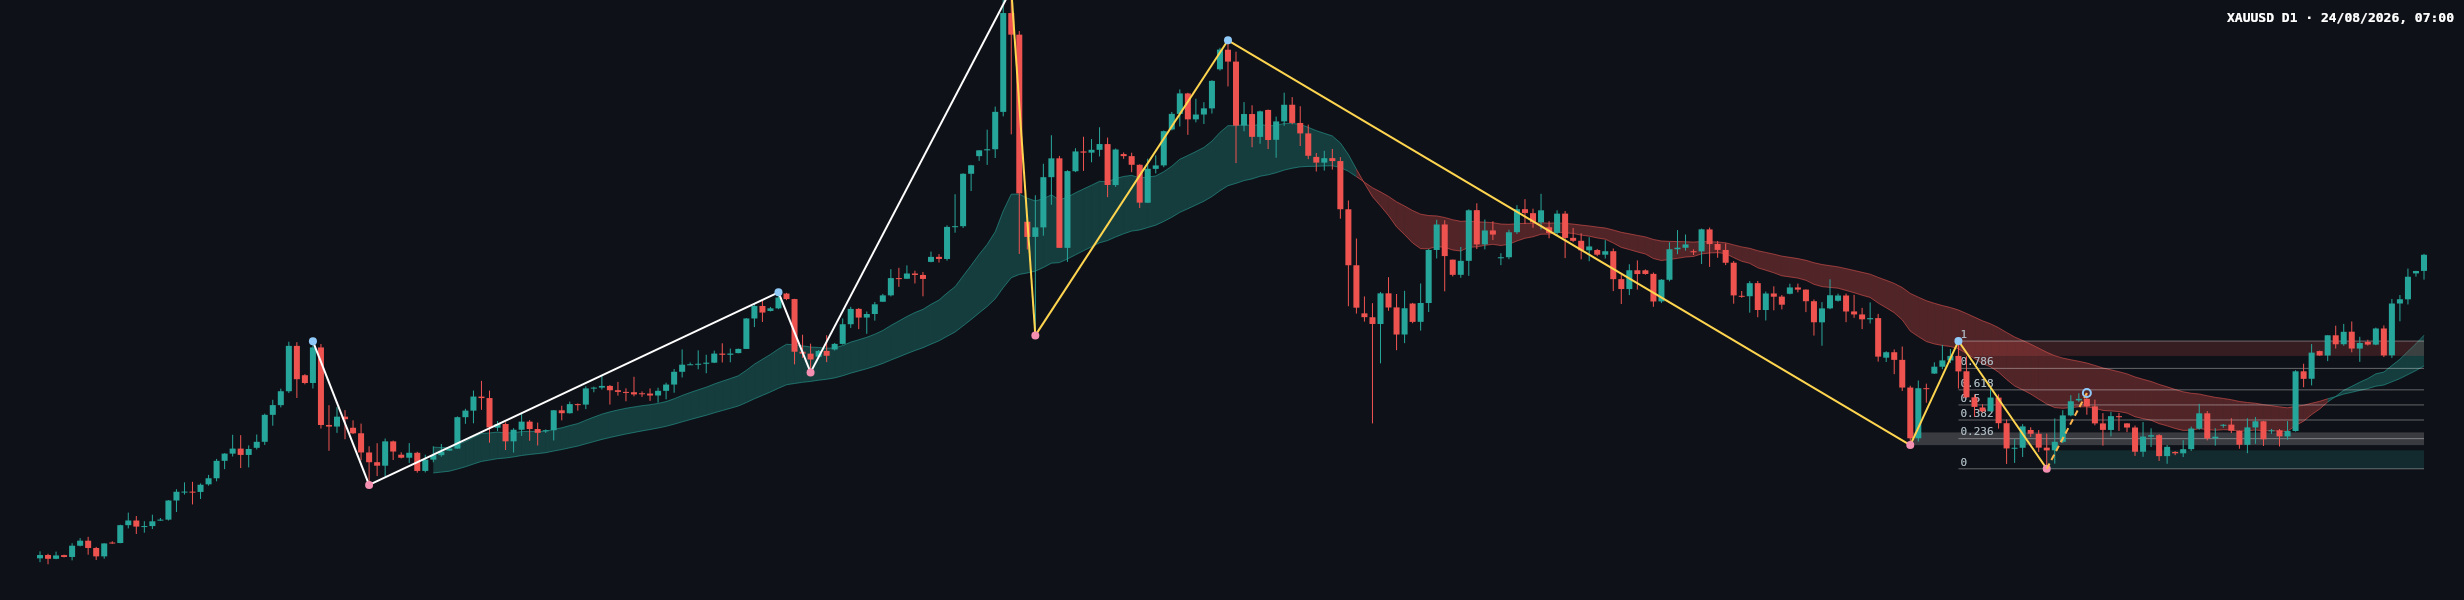
The important Daily structure event is a change of character at 4382.441. The latest completed Dow leg runs from 3942.138 to 4382.441, and the current retracement ratio is 1.000. The Fibonacci levels within that leg are 4046.050 at 0.236, 4110.334 at 0.382, 4162.290 at 0.5, 4214.245 at 0.618, and 4288.216 at 0.786.
The latest confirmed Daily swing is a low at 3942.138. The Daily resistance zone is 4331.294–4382.441, while support is marked at 3942.138–4005.629. The area at 4023.812–4067.479 is a broken-retest resistance zone. Since the latest close is 4679.801, price is above the listed Daily resistance and above the Fibonacci leg's upper endpoint, but the report does not establish whether this clearance has been confirmed by a further structural event.
Recent candle and momentum reading
The chart's latest price action shows a recovery from the region around the Daily support and a subsequent push higher. The most recent visible candles are predominantly advancing, with the latest close at 4679.801 near the upper portion of the displayed recovery. This favors buyers in the immediate Daily sub-trend, although the broader Daily classification remains down and shaky.
The exact candle classification, including whether the latest candle qualifies as a Marubozu, Pin bar, Doji, Engulfing candle, Inside bar, or Spinning top, is not determinable from the deterministic report. The same applies to precise body-to-wick comparisons and volume confirmation. The chart does not provide a numerical volume reading in the report, so volume or momentum divergence cannot be confirmed.
Relative to the Fibonacci structure, the latest close is above 4382.441 and the current retracement ratio is 1.000. This suggests that the recovery has moved beyond the latest completed leg's endpoint, but the next question is whether price can hold above that level rather than merely trade above it temporarily.
Key levels
- 5595.362: most recent confirmed weekly swing high.
- 5019.871–5595.362: major weekly resistance zone.
- 4679.801: latest Daily close.
- 4331.294–4382.441: Daily resistance zone and key structural reference.
- 4382.441: Daily CHoCH level and upper endpoint of the latest completed Fibonacci leg.
- 4288.216, 4214.245, 4162.290, 4110.334, and 4046.050: Fibonacci references.
- 4023.812–4067.479: broken-retest resistance zone.
- 3942.138–4005.629: Daily support zone.
- 2536.779–2660.238 and 2666.640–2790.099: weekly support areas.
Conditional scenarios
Primary scenario: recovery holds above the Daily structure level
If price remains above 4382.441 and continues to build acceptance above the Daily resistance zone at 4331.294–4382.441, the upward Daily sub-trend would retain control. The next higher-timeframe reference would be the weekly resistance zone at 5019.871–5595.362. Invalidation would be a return below 4382.441 followed by renewed pressure through 4331.294. A precise probability is not determinable from the report.
Secondary scenario: range or failed continuation
If price holds above 4382.441 but fails to progress toward 5019.871–5595.362, the market may consolidate between the current close at 4679.801 and the former Daily resistance region at 4331.294–4382.441. This would represent hesitation beneath weekly supply rather than a confirmed reversal. Invalidation would be sustained acceptance above the weekly resistance zone or a decisive break below 4331.294. Probability is not determinable from the report.
Risk scenario: bearish rejection and retracement
If the recovery is rejected and price falls back below 4382.441, the Fibonacci references at 4288.216, 4214.245, 4162.290, 4110.334, and 4046.050 become relevant areas for assessing renewed selling pressure. A deeper bearish continuation would bring the Daily support zone at 3942.138–4005.629 back into focus. The scenario would be weakened by a sustained reclaim of 4382.441. Probability is not determinable from the report.
What to monitor
The central confirmation question is whether Daily closes can remain above 4382.441 after the CHoCH. A successful hold would support the recovery interpretation; repeated rejection below 5019.871–5595.362 would keep the weekly supply risk active. Conversely, a move below 4331.294 would warn that the recent strength is losing structure.
No news or economic-calendar context was supplied with the deterministic report. Traders should therefore remain aware of scheduled macroeconomic releases, changes in the US dollar, movements in US yields, and geopolitical headlines, without assuming a particular event outcome. General risk controls remain important, including avoiding oversized exposure and allowing for volatility around major announcements.
For the current session, the Daily chart leans toward recovery while price holds above 4382.441, but the weekly chart limits confidence below 5019.871–5595.362. The expected directional range cannot be quantified from the supplied report.
Summary
- The weekly trend is firmly up, with no recorded weekly structure event and a confirmed swing high at 5595.362.
- The weekly sub-trend is down, and major resistance remains at 5019.871–5595.362.
- The Daily trend is down but shaky, with an upward sub-trend and a CHoCH at 4382.441.
- The latest Daily close at 4679.801 is above the completed Fibonacci leg's endpoint.
- A fall back below 4382.441 would reopen the Fibonacci and Daily support references, including 3942.138–4005.629.
The single most important thing today is whether price can maintain acceptance above 4382.441 without being rejected by the weekly resistance zone at 5019.871–5595.362.
#XAUUSD #Gold #TechnicalAnalysis #PriceAction #Forex
SEO description: XAU/USD analysis covering the weekly uptrend, Daily CHoCH at 4382.441, Fibonacci structure, support, resistance, and conditional scenarios.
This article is technical analysis and reference information only, not investment advice. Markets carry risk, and readers are responsible for their own decisions.