
XAU/USD is caught between a firm weekly uptrend and a shaky daily downtrend. The last closed weekly price is 4375.817, while the last closed daily price is 4332.893. The most notable development on the main frame is the daily CHoCH associated with 4382.441, followed by a recovery into the daily resistance zone at 4331.294–4382.441.
| Metric | Reading |
|---|---|
| Weekly last closed price | 4375.817 |
| Daily last closed price | 4332.893 |
| Weekly trend | Up, with a downward sub-trend |
| Daily trend | Down, with an upward sub-trend |
| Nearest resistance | 4331.294–4382.441 |
| Nearest support | 3942.138–4005.629 |
| Active Fibonacci retracement | 0.887 |
Higher-timeframe context
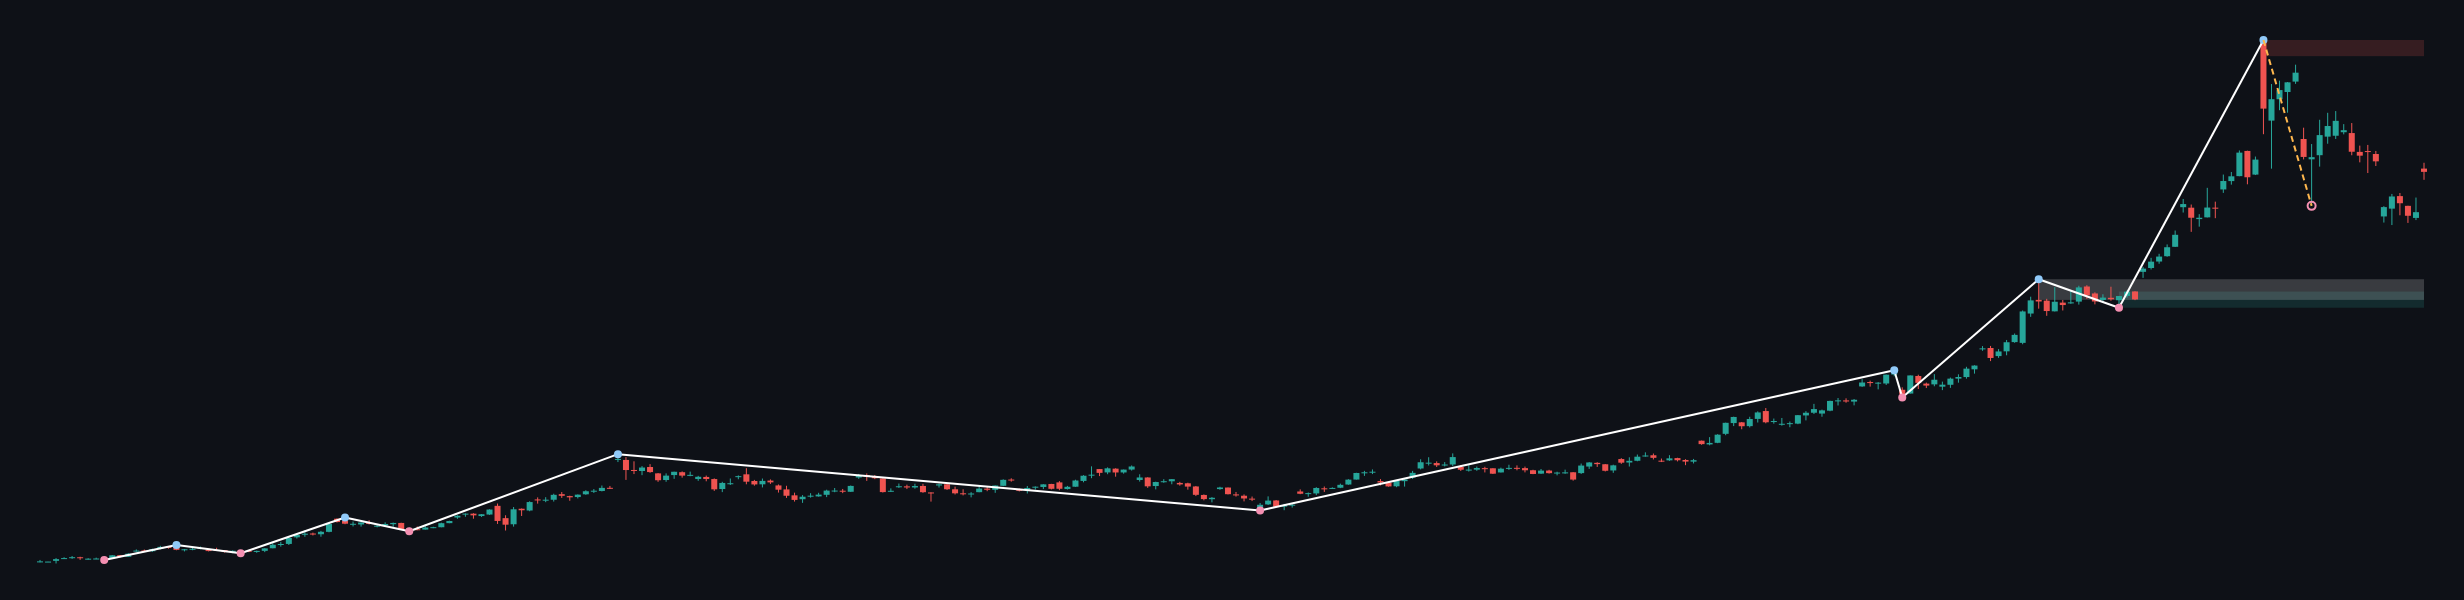
The weekly structure remains constructive because the main trend is up and the most recent confirmed swing is a high at 5450.970. The report identifies no weekly structure event, so there is no confirmed weekly break altering that framework. The downward weekly sub-trend indicates a pullback or consolidation within the broader advance rather than a confirmed change of the primary trend.
Weekly price is positioned below the major resistance zone at 5319.703–5450.970 and above the support zone at 3268.058–3399.325. A former support area at 3331.873–3500.057 is marked as a broken-retest zone. These zones define the wider context: the market has substantial room below before reaching the principal weekly support areas, but the confirmed swing high at 5450.970 remains the larger structural ceiling.
Weekly EMA positioning, spacing and crossover status are not determinable from the deterministic report. Weekly Fibonacci readings are also not supplied, so interaction with a specific weekly Fibonacci ratio cannot be confirmed.
Main-frame structure
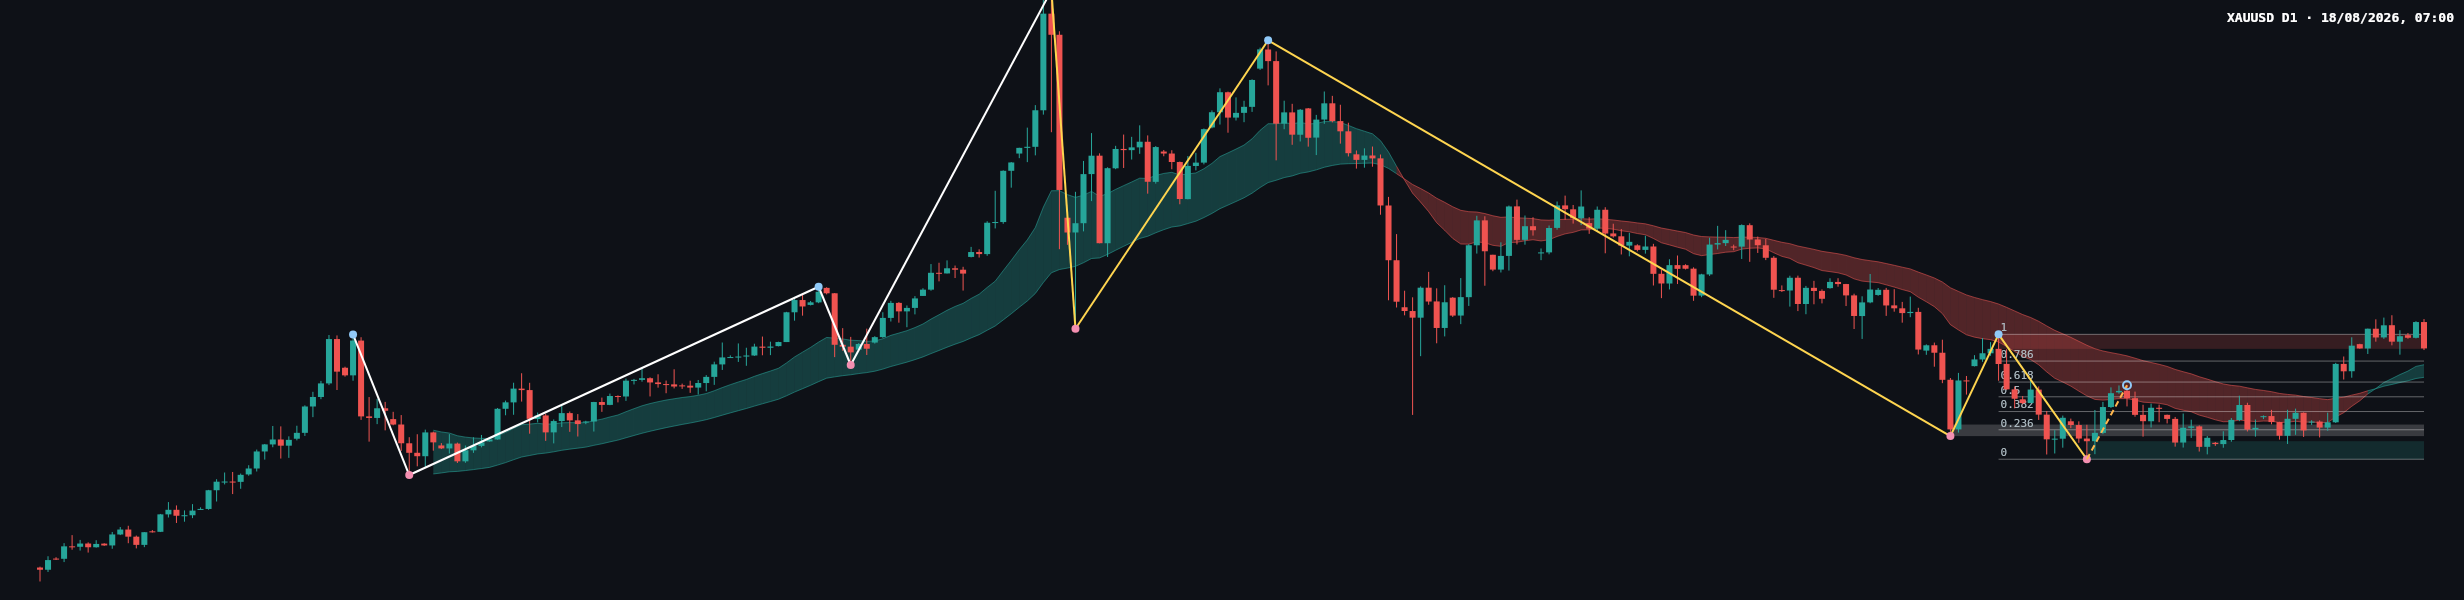
The daily main trend is down but shaky, while the sub-trend is up. This conflicts with the weekly direction and leaves two interpretations open: the recovery may be a counter-trend pullback inside the daily decline, or it may be an early reversal attempt. The daily CHoCH at 4382.441 is the central reference for distinguishing those possibilities.
The latest completed Dow leg runs from 3942.138 to 4382.441. Its listed Fibonacci levels are 4046.050 at 0.236, 4110.334 at 0.382, 4162.290 at 0.5, 4214.245 at 0.618 and 4288.216 at 0.786. The current retracement ratio is 0.887, placing price close to the upper end of that completed leg and near the resistance boundary at 4382.441.
Daily EMA values, exact slopes, spacing and crossover status are not determinable from the report. The chart does show a prior declining ribbon during the sell-off, followed by price recovery toward that area, but the supplied data does not provide enough information to describe a confirmed moving-average crossover.
The recent candles show a recovery from the area around the daily low at 3942.138, followed by consolidation and renewed upward pressure into the 4331.294–4382.441 zone. The latest candle appears relatively compact compared with the preceding recovery sequence, with its close near the upper part of the visible recent range. This suggests that buyers remain active, but the location at resistance means seller response is still unresolved.
Volume and a separate momentum reading are not supplied by the deterministic report. The price structure itself provides the clearer signal: buyers have recovered the area around 4288.216, but sustained acceptance above 4382.441 is not yet confirmed.
Key levels
- 4331.294–4382.441: daily resistance and the principal decision zone.
- 4382.441: broken level associated with the daily CHoCH and the upper boundary of the resistance zone.
- 4288.216: daily Fibonacci 0.786 reference below the current resistance.
- 4214.245: daily Fibonacci 0.618 reference if the recovery loses momentum.
- 4023.812–4064.408: broken-retest resistance zone that may become relevant during a deeper corrective move.
- 3942.138–4005.629: daily support zone and the area containing the most recent confirmed swing low at 3942.138.
- 5319.703–5450.970: major weekly resistance above the current market structure.
- 3268.058–3399.325: major weekly support below the daily support area.
Conditional scenarios
Bullish continuation
If price achieves sustained acceptance above 4382.441, the daily CHoCH would receive stronger confirmation and the upward sub-trend would have greater structural support. The next wider reference would be the weekly resistance zone at 5319.703–5450.970. This scenario would be invalidated if price rejects the resistance area and moves back below 4288.216, restoring the appearance of a failed recovery.
Relative likelihood: the more constructive scenario, but confirmation requires a decisive daily reaction above 4382.441. A numerical probability is not supplied by the deterministic report.
Bearish rejection
If price fails to hold above the daily resistance zone at 4331.294–4382.441, sellers could press the market back toward 4288.216 and then the lower Fibonacci references at 4214.245 and 4162.290. A deeper decline would bring the broken-retest area at 4023.812–4064.408 into focus. This scenario would be weakened if price regains and holds above 4382.441.
Relative likelihood: a credible counter-scenario because the daily main trend remains down and price is testing resistance. No numerical probability is provided.
Wider risk scenario
If selling pressure becomes strong enough to break below 3942.138, the daily support zone at 3942.138–4005.629 would no longer be holding in its current form. Attention could then shift toward the broader weekly support zone at 3268.058–3399.325. This scenario would be invalidated by a sustained recovery above 4382.441.
Session considerations
The cleanest technical information is likely to come from how price behaves around 4331.294–4382.441 and whether a retest of 4288.216 holds after any attempted breakout. A close above 4382.441 would support the bullish interpretation; rejection from that level followed by a close below 4288.216 would favor the bearish interpretation.
False breaks and liquidity sweeps are especially relevant around the resistance zone. A brief move through 4382.441 without continued acceptance would carry less structural significance than a sustained close and successful retest. Conversely, a dip toward 4288.216 or 4214.245 that quickly recovers would suggest that buyers are defending the retracement structure.
No economic-calendar schedule or exact event time is included in the deterministic report. Traders should independently monitor the calendar, the US dollar, Treasury yields, central-bank communication and geopolitical headlines, since these can alter gold volatility around the marked levels.
Summary
- The weekly main trend is up, with no confirmed weekly structure event.
- The daily main trend is down but shaky, while the sub-trend is up after a CHoCH at 4382.441.
- The key decision zone is 4331.294–4382.441.
- A bullish case requires acceptance above 4382.441; rejection can expose 4288.216, 4214.245 and lower references.
- The deeper bearish risk is a break of 3942.138, which would refocus attention on the broader weekly support zone.
The single most important thing today is the market's reaction to 4382.441 and the surrounding resistance zone.
#XAUUSD #Gold #PriceAction #DowTheory #TechnicalAnalysis
Meta description: XAU/USD tests daily resistance at 4331.294–4382.441 while weekly and daily trends remain misaligned.
This article is technical analysis and reference information only, not investment advice. Markets carry risk, and readers are responsible for their own decisions.