
XAU/USD is at a decision area where the higher-timeframe trend and the daily structure are not fully aligned. The weekly chart retains a firm uptrend, while the daily chart is classified as a shaky downtrend with an upward sub-trend. The most notable development is the daily change of character associated with the broken level at 4382.441, while the latest daily close at 4370.395 remains inside the nearby resistance zone.
| Metric | Reading |
|---|---|
| Weekly last closed price | 4375.817 |
| Daily last closed price | 4370.395 |
| Weekly trend | Up, firm; sub-trend down |
| Daily trend | Down, shaky; sub-trend up |
| Daily structure | CHoCH at 4382.441 |
| Daily resistance | 4331.294–4382.441 |
| Daily support | 3942.138–4005.629 |
| Current retracement ratio | 0.973 |
Higher-timeframe context
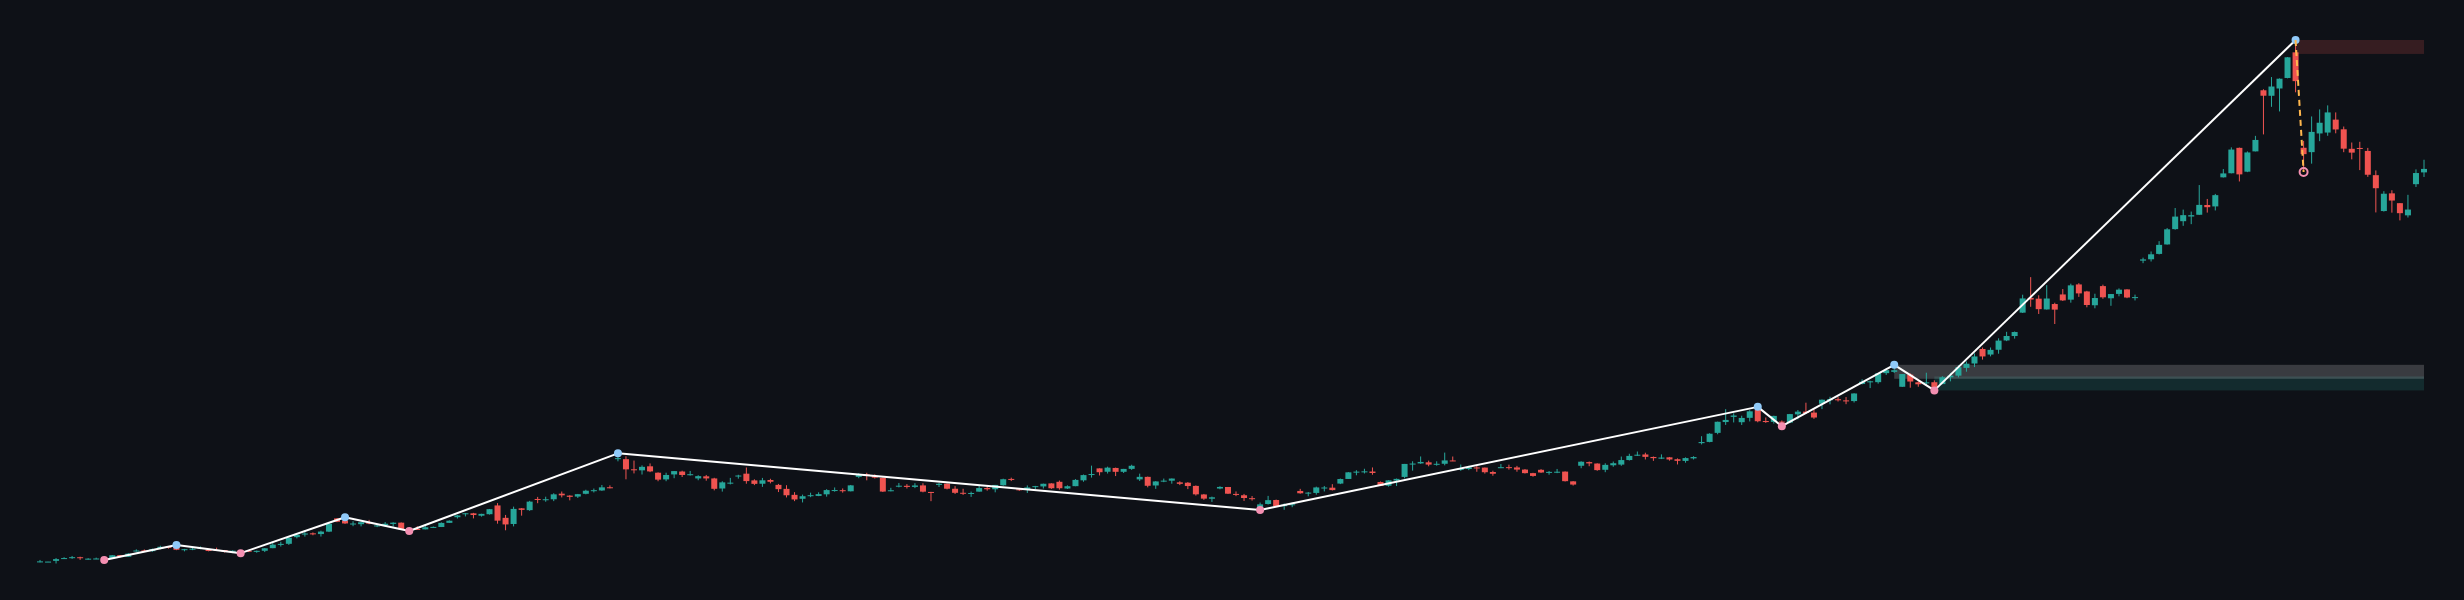
The weekly framework remains constructive because the main trend is recorded as up and firm. However, the weekly sub-trend is down, so the current advance is still developing beneath a broader corrective phase rather than presenting an unqualified continuation signal. No weekly structure event is reported.
The most recent confirmed weekly swing is a high at 5419.206. The principal weekly resistance zone is 5306.659–5419.206, placing the confirmed swing high at the upper boundary of that area. Weekly support is identified at 2583.429–2695.976, while the separate broken-retest support zone is 2677.552–2790.099. These wider zones define the larger directional map, although the daily resistance is the nearer decision area.
The weekly ATR is 225.095. The report does not provide numerical readings for the weekly moving averages, their spacing, or any crossover, so those characteristics are not determinable from the supplied data report.
Main-frame structure
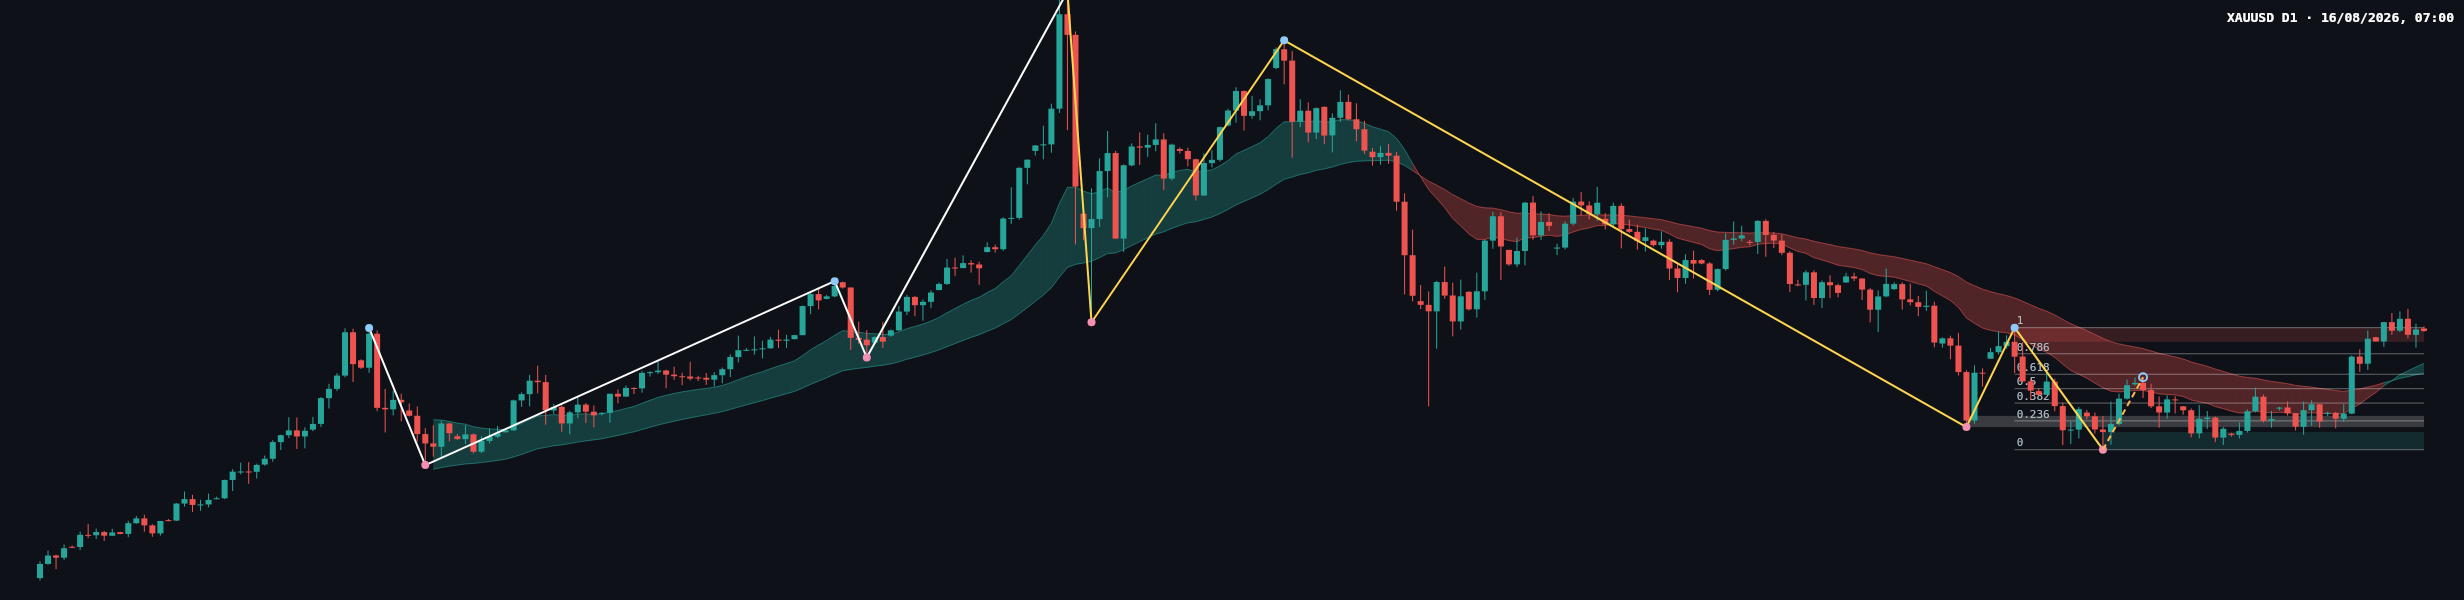
On the daily frame, the main trend is down but shaky, while the sub-trend is up. This creates a transitional condition: the recent upward movement may be a pullback within the daily decline, but the reported CHoCH at 4382.441 also provides an early reversal signal if buyers can defend the break and build acceptance above the resistance zone.
The daily resistance zone spans 4331.294–4382.441. The latest close at 4370.395 is therefore near the upper part of this zone and close to the broken level at 4382.441. The key daily support zone is 3942.138–4005.629, with the most recent confirmed swing low at 3942.138. The broken-retest resistance zone at 4023.812–4064.042 remains an important intermediate structural reference.
The daily ATR is 80.460. Numerical moving-average values are not included in the report, so the exact distance between the moving averages, their slope, and any crossover are not determinable. The chart shows moving-average overlays, but the analysis here relies on the supplied levels and structure readings rather than estimating values from the image.
Key levels and Fibonacci positioning
The latest completed daily Dow leg runs from the Fibonacci level at 3942.138 to the level at 4382.441. Its reported levels are 4046.050 at 0.236, 4110.334 at 0.382, 4162.290 at 0.5, 4214.245 at 0.618, and 4288.216 at 0.786. The current retracement ratio is 0.973, placing price close to the 1 level at 4382.441.
This positioning makes 4331.294–4382.441 the main area to observe for acceptance or rejection. A sustained move above 4382.441 would improve the daily reversal case. Failure to hold the zone, particularly if price loses 4331.294, would keep the broader daily downtrend relevant. Below, the retracement levels at 4288.216 and 4214.245 can help describe intermediate movement, while 4023.812–4064.042 and 3942.138–4005.629 remain the deeper support references.
Recent daily price action
The latest candles on the supplied daily chart show a recovery from the lower support area, followed by a sharp upward push into the resistance band. The most recent group is comparatively compact near the top of the advance, with alternating candle colors and visible wicks. This indicates that buyers have regained short-term control, but sellers are still active around 4331.294–4382.441.
The latest closing candle cannot be assigned a definitive classical label from the deterministic report alone. Its practical meaning is conditional: a close that remains near 4370.395 but below 4382.441 shows pressure at resistance rather than confirmed acceptance above it. A subsequent daily close above 4382.441 would strengthen the bullish interpretation; rejection and movement back below 4331.294 would favor the bearish interpretation.
Conditional scenarios
Bullish continuation or reversal scenario
If the daily market closes above 4382.441 and holds that level on a retest, the CHoCH would receive confirmation and the upward daily sub-trend could develop into a broader reversal. The next major higher-timeframe resistance reference would be 5306.659–5419.206. This scenario would be invalidated by a return below 4331.294 after the attempted breakout.
Bearish rejection scenario
If price is rejected from 4331.294–4382.441 and then loses 4331.294, the daily downtrend would remain influential. The first Fibonacci reference below is 4288.216, followed by 4214.245 and the broken-retest zone at 4023.812–4064.042. A deeper bearish continuation would bring 3942.138–4005.629 into focus. This scenario would be invalidated by sustained acceptance above 4382.441.
Range and failed-break scenario
Price may continue to rotate around the daily resistance zone without producing a decisive structural follow-through. In that case, repeated tests of 4382.441 that fail to close above it would preserve the range interpretation, while losses of 4331.294 would increase the risk of a move toward 4288.216. This scenario is invalidated by a clear daily break and hold above 4382.441 or by a decisive break through the lower support references.
No scenario probabilities are assigned because the deterministic report provides no probability estimates. The directional bias leans cautiously bullish only while the daily structure holds above 4331.294; below that level, the bearish weekly sub-trend and daily main trend regain greater weight.
Closing assessment
- The weekly main trend is up and firm, but its sub-trend is down.
- The daily main trend is down and shaky, with an upward sub-trend.
- The central decision zone is 4331.294–4382.441.
- A confirmed daily hold above 4382.441 would support a broader reversal interpretation.
- Rejection below 4331.294 would keep 4288.216, 4214.245, and the lower support zones relevant.
The single most important consideration is whether price can establish acceptance above 4382.441 or instead confirms rejection from the 4331.294–4382.441 resistance zone.
This article is technical analysis and reference information only, not investment advice. Markets carry risk, and readers are responsible for their own decisions.