
XAU/USD is trading at 4375.817, close to the upper boundary of the daily resistance zone at 4331.294–4382.441. The higher-timeframe picture remains firmly constructive, while the daily chart is showing an early attempt to reverse its prior decline after a change of character around 4382.441.
| Metric | Value |
|---|---|
| Most recent close | 4375.817 |
| Weekly trend | Up, firm; sub-trend down |
| Daily trend | Down, shaky; sub-trend up |
| Nearest resistance | 4331.294–4382.441 |
| Nearest support | 3942.138–4005.629 |
| Active Fibonacci reading | Current retracement ratio: 0.985 |
| Daily structure | CHoCH after a break of 4382.441 |
Higher-timeframe context
The weekly chart still carries a firm upward main trend. The most recent confirmed weekly swing is a high at 5450.970, while the current sub-trend is down. No weekly structure event is reported, so the pullback has not yet invalidated the broader upward framework.
Weekly price is well above the broken-retest support zone at 3331.873–3500.057 and also above the broader support zone at 3268.058–3392.333. The weekly resistance zone is located at 5326.695–5450.970. Relative to the current close of 4375.817, this leaves the market between major weekly demand below and the confirmed swing high area above.
The weekly ATR is 248.550, indicating a considerably wider higher-timeframe movement backdrop than the daily ATR of 85.117. The weekly chart therefore permits further upside if the daily recovery develops into a sustained structural advance, but it also leaves room for a substantial retracement without immediately damaging the broader trend.
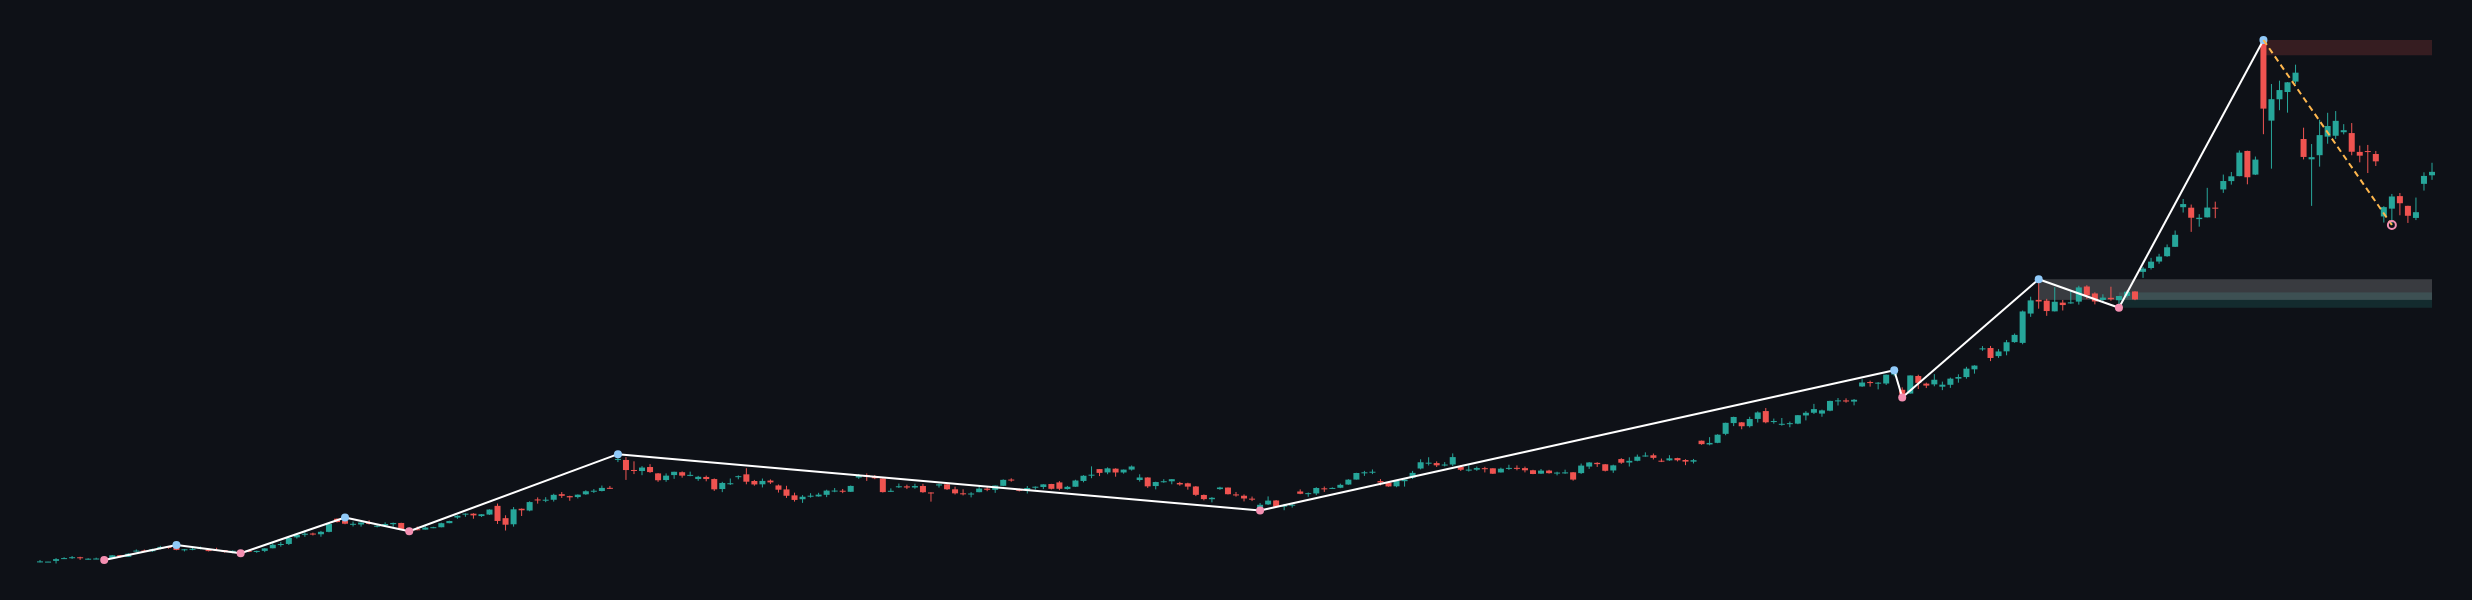
Weekly conclusion: the higher timeframe favors the bullish side because the main trend remains up and no weekly break of structure is reported. The main caution is the active weekly sub-trend down and the distance from the major resistance zone at 5326.695–5450.970.
Main-frame structure
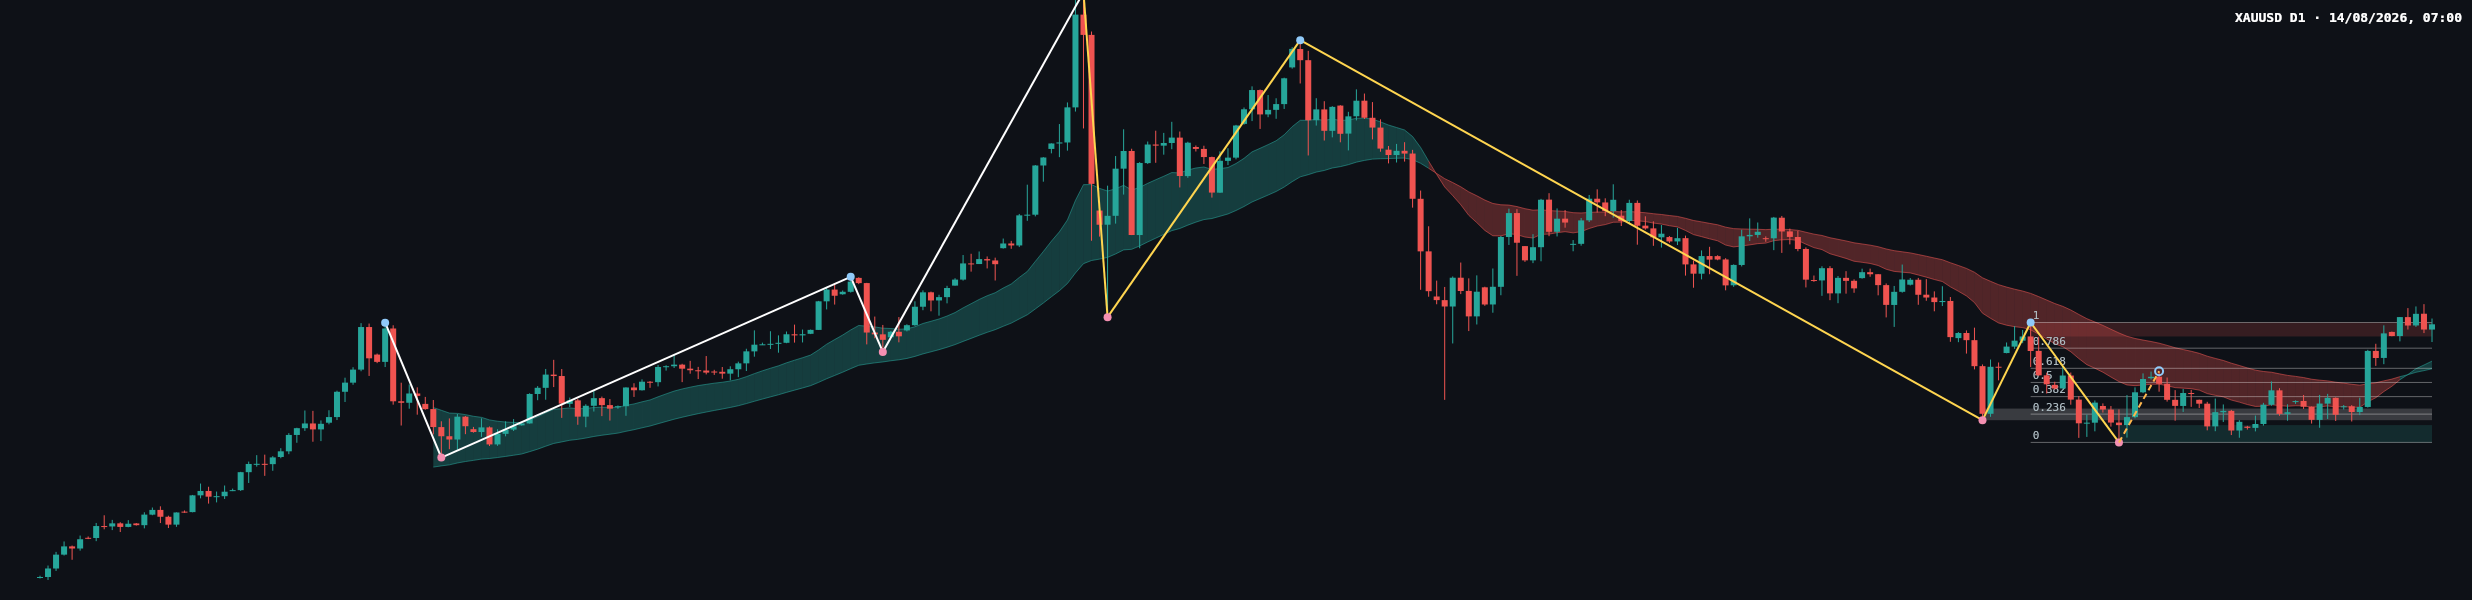
The daily main trend is down, although it is described as shaky, while the daily sub-trend is up. This is not fully aligned with the weekly chart: it can be read as an early reversal attempt within a larger weekly uptrend, rather than as confirmation that the daily decline has already ended.
The key daily structure event is a CHoCH associated with the broken level at 4382.441. The last closed price at 4375.817 is just below that level and remains inside the daily resistance zone at 4331.294–4382.441. A sustained move above that zone would give the bullish structure more credibility; rejection from it would preserve the possibility that the daily downtrend is still active.
The daily support zone at 3942.138–4005.629 contains the most recent confirmed swing low at 3942.138. A second, former resistance zone at 4023.812–4066.370 is marked as a broken-retest area. These zones provide the main downside reference points if the current recovery fails.
The latest completed Dow leg runs from 3942.138 to 4382.441. Its listed Fibonacci levels are 4046.050 at 0.236, 4110.334 at 0.382, 4162.290 at 0.5, 4214.245 at 0.618, and 4288.216 at 0.786. The current retracement ratio is 0.985, placing price close to the upper end of that completed leg and near the reference level of 4382.441.
Recent candles and closing-candle reading
The visible daily candles near the latest close show consolidation after a strong recovery from the lower support area. The most recent group contains relatively compact bodies with both upper and lower wicks, followed by a modest upward push. This suggests that buyers have regained short-term control, but sellers are still active around the resistance zone at 4331.294–4382.441.
The latest closing candle is best treated as a tentative continuation candle rather than a confirmed breakout candle. Its close at 4375.817 is near the upper boundary of the daily resistance zone but remains below 4382.441. That location indicates buying pressure, while the failure to close beyond the upper boundary leaves room for rejection or consolidation.
Compared with the preceding consolidation, the latest candle does not by itself provide enough evidence of decisive acceptance above resistance. The buyer-versus-seller story is therefore conditional: buyers control the short-term recovery, but sellers retain the technical advantage while price remains inside or below 4331.294–4382.441.
Key levels
- 4382.441: upper boundary of the main daily resistance zone and the broken level associated with the CHoCH.
- 4331.294–4382.441: immediate daily resistance area.
- 4288.216: listed 0.786 Fibonacci level below the current close.
- 4023.812–4066.370: broken-retest resistance zone that may become relevant on a deeper decline.
- 3942.138–4005.629: daily support zone containing the most recent confirmed swing low.
- 3331.873–3500.057 and 3268.058–3392.333: major weekly support zones.
- 5326.695–5450.970: major weekly resistance and the area containing the most recent confirmed weekly high.
Conditional scenarios
Bullish scenario
If price establishes acceptance above 4382.441, the daily CHoCH would receive confirmation and the current sub-trend up could begin challenging the broader weekly resistance zone at 5326.695–5450.970. The scenario would be invalidated if price returns below the immediate resistance area at 4331.294–4382.441 and fails to hold it as support. Estimated probability: not determinable from the deterministic report.
Bearish scenario
If price rejects the daily resistance zone and breaks below 4331.294, the recovery would be treated as unsuccessful. The next important downside reference is the daily support zone at 3942.138–4005.629, with the former broken-retest area at 4023.812–4066.370 potentially acting as an intermediate reaction zone. This scenario would be invalidated by sustained acceptance above 4382.441. Estimated probability: not determinable from the deterministic report.
Range and failed-break scenario
If price remains between the resistance boundaries at 4331.294 and 4382.441, the market may continue to consolidate while buyers and sellers test the CHoCH area. A rejection followed by movement toward 4023.812–4066.370 would keep the range-to-downside interpretation active, while a close above 4382.441 would invalidate it in favor of the bullish scenario. Estimated probability: not determinable from the deterministic report.
What to monitor
- Whether daily closes hold above or reject 4382.441.
- Whether the zone at 4331.294–4382.441 changes from resistance into support.
- Whether weakness reaches 4023.812–4066.370 or the broader support zone at 3942.138–4005.629.
- Whether the Fibonacci reference at 4288.216 supports the current recovery or fails during a pullback.
- Whether the daily sub-trend up can overcome the still-down daily main trend.
The cleanest confirmation would come from a decisive daily close beyond 4382.441 followed by evidence that the zone at 4331.294–4382.441 is being respected from above. Conversely, repeated rejection inside that zone and a break below 4331.294 would favor a return toward the lower daily references.
No news or economic-calendar context is supplied in the deterministic report. Traders should therefore treat external catalysts, liquidity conditions and volatility as unknown rather than assuming that the technical pattern will develop without interruption.
Summary
- The weekly main trend remains up and firm, despite a down sub-trend.
- The daily trend is down but shaky, with a sub-trend up and a reported CHoCH at 4382.441.
- Price at 4375.817 is pressing against daily resistance at 4331.294–4382.441.
- A confirmed move above 4382.441 would strengthen the bullish reversal interpretation.
- A break below 4331.294 would refocus attention on 4023.812–4066.370 and 3942.138–4005.629.
The single most important thing today is whether price can achieve sustained acceptance above 4382.441 or is rejected from the daily resistance zone.
#XAUUSD #GoldAnalysis #PriceAction #DowTheory #TechnicalAnalysis
Meta description: XAU/USD tests daily resistance at 4331.294–4382.441 as weekly strength meets a shaky daily downtrend.
This article is technical analysis and reference information only, not investment advice. Markets carry risk, and readers are responsible for their own decisions.