
XAU/USD is trading at 4371.409 on the daily frame, pressing against the 4331.294–4382.441 resistance zone. The higher-timeframe trend remains firmly upward, while the daily structure is more mixed: a recent CHoCH has been recorded at 4382.441, but price is still interacting with a major decision area rather than trading in clear open space.
| Metric | Value |
|---|---|
| Most recent daily close | 4371.409 |
| Most recent weekly close | 4342.514 |
| Weekly trend | Up, with a downward sub-trend |
| Daily trend | Down, with an upward sub-trend |
| Nearest resistance | 4331.294–4382.441 |
| Nearest support | 3942.138–4005.629 |
| Active Fibonacci retracement | 0.975 |
Higher-timeframe context
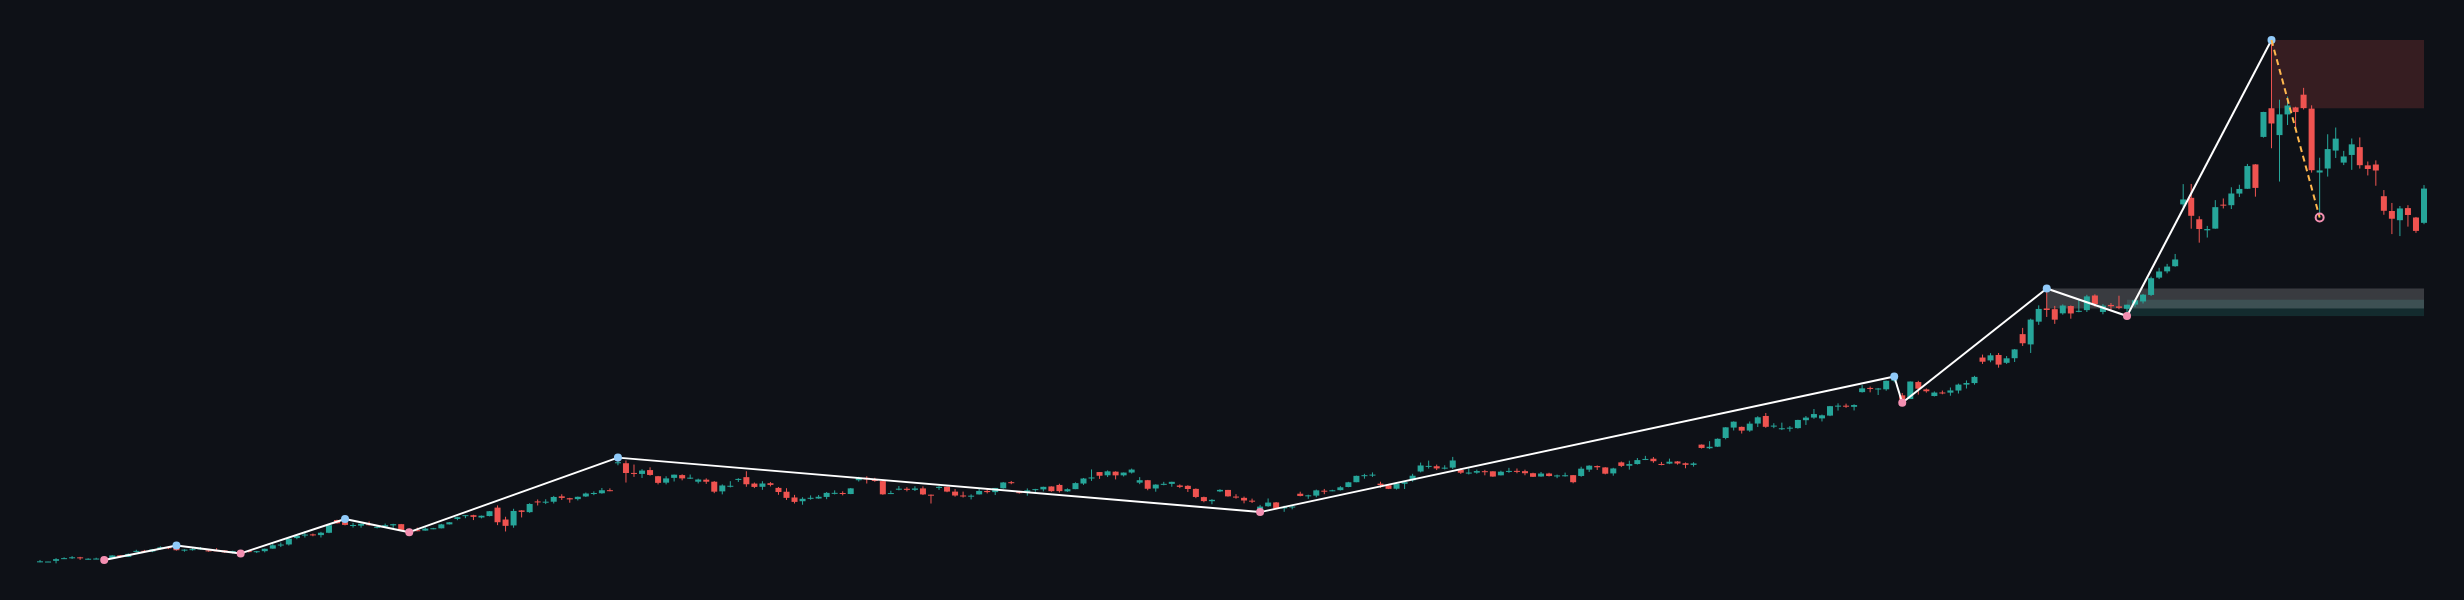
The weekly chart continues to show a firm primary uptrend. The most recent confirmed swing is a high at 5595.362, while the weekly sub-trend is down. No weekly structure event is recorded, so the broader bullish framework remains intact despite the corrective phase.
Weekly support is marked at 3268.058–3405.143, with a separate broken-retest support zone at 3331.873–3500.057. These areas are materially below the current weekly close of 4342.514. The major weekly resistance zone is 5019.871–5595.362, placing the market between established higher-timeframe demand and supply.
The weekly chart therefore permits further upside if the daily recovery develops into a sustained structural advance. However, the downward weekly sub-trend means that rejection from the daily resistance area would still be consistent with a broader correction rather than an immediate failure of the weekly uptrend.
Main-frame structure
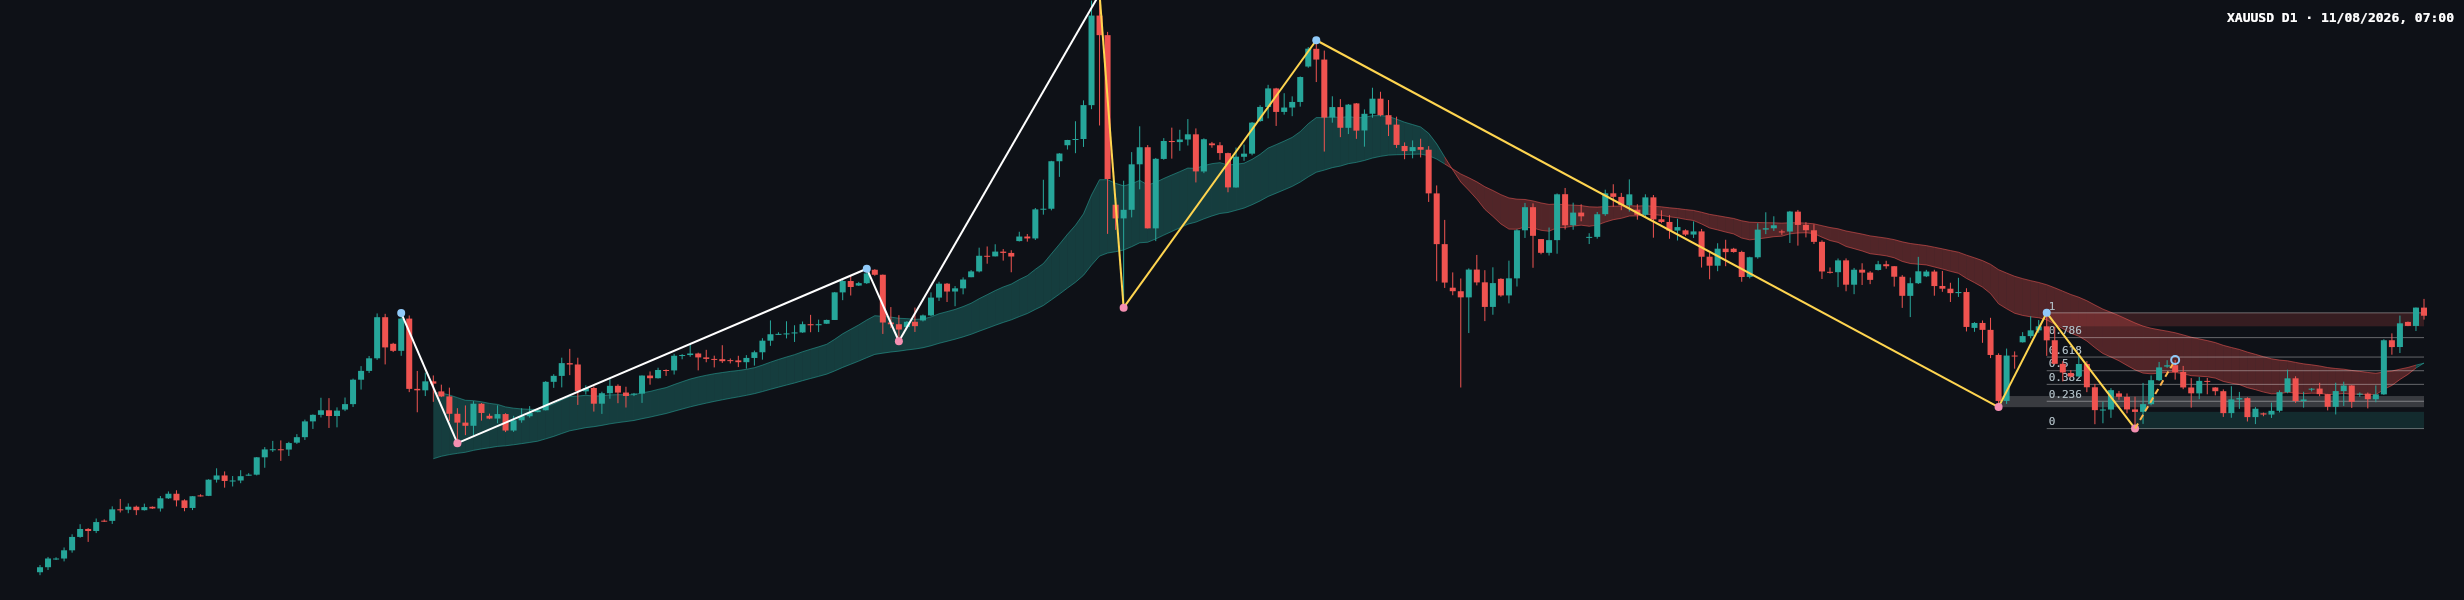
On the daily chart, the main trend is down but shaky, while the sub-trend is up. This creates a conflict between the established decline and the recent recovery. The recorded CHoCH at 4382.441 is the central structural reference: acceptance above it would strengthen the reversal interpretation, while rejection below the surrounding resistance would leave the broader daily downtrend relevant.
The daily resistance zone spans 4331.294–4382.441. Price at 4371.409 is inside this zone and close to its upper boundary. The next substantial upside reference is the weekly resistance area at 5019.871–5595.362. On the downside, the main daily support zone is 3942.138–4005.629. A lower broken-retest resistance zone at 4023.812–4065.841 may also become relevant if weakness develops.
The latest completed Dow leg runs from the confirmed low at 3942.138 to 4382.441. Its Fibonacci levels are 4046.050 at 0.236, 4110.334 at 0.382, 4162.290 at 0.5, 4214.245 at 0.618, and 4288.216 at 0.786. The current retracement ratio is 0.975, indicating that price has recovered most of that leg and is testing the prior extreme at 4382.441.
Recent price action and candle reading
The most recent daily candles show a rebound from the lower consolidation area into the resistance band. The advance culminates in a cluster of candles near 4331.294–4382.441, where the chart shows hesitation rather than a clean, sustained escape. The latest close at 4371.409 remains below 4382.441, so the structural break is not yet fully confirmed by continued separation from the zone.
The precise candle classification, close location within each range, and EMA values are not determinable from the deterministic report. The chart does show moving-average bands, but their exact values are not supplied. Consequently, the reliable reading comes from price location: buyers have regained the 4288.216 Fibonacci reference and pushed toward 4382.441, while sellers remain active inside the resistance zone.
Momentum or volume confirmation is also not provided in the report. The price-action evidence is therefore conditional. A daily close above 4382.441 would support continuation, while a failure to hold above 4331.294 would suggest that supply is still controlling the area.
Key levels
- 4382.441: upper boundary of daily resistance and the broken level associated with the CHoCH.
- 4331.294–4382.441: immediate decision zone.
- 4288.216: daily Fibonacci 0.786 reference.
- 4023.812–4065.841: broken-retest resistance zone below the market.
- 3942.138–4005.629: principal daily support zone.
- 5019.871–5595.362: major weekly resistance zone if the daily breakout extends.
- 3268.058–3405.143 and 3331.873–3500.057: important weekly support areas.
Conditional scenarios
Bullish continuation
If price achieves a sustained daily close above 4382.441 and holds that level on a retest, the CHoCH would receive stronger confirmation. The next major upside area would be the weekly resistance zone at 5019.871–5595.362. This scenario would be invalidated by a return below 4331.294, particularly if the market closes back inside the resistance zone.
Bearish rejection
If price is rejected from 4331.294–4382.441 and moves back below 4331.294, the daily downtrend would remain influential. The first lower references are 4288.216, followed by the broken-retest zone at 4023.812–4065.841 and the main support at 3942.138–4005.629. This scenario would be invalidated by sustained acceptance above 4382.441.
Range continuation
Price may continue to consolidate between the lower and upper boundaries of 4331.294–4382.441 while the market weighs the recent CHoCH against the broader daily downtrend. This is the neutral scenario. It would lose relevance after a decisive daily close above 4382.441 or below 4331.294.
The scenario ranking is qualitative because the deterministic report does not provide numerical probability estimates. At present, the daily bias leans cautiously bullish while price holds the recovery structure, but the weekly and daily resistance overlap makes confirmation essential.
Session considerations
The cleanest technical information would come from observing how price behaves at 4382.441 and 4331.294. A successful retest above 4382.441 would favor continuation, while rejection and a close below 4331.294 would favor a return toward 4288.216 and lower support references.
False breakouts and liquidity sweeps are possible around the upper resistance boundary. The report contains no scheduled-news times or specific fundamental releases, so the timing impact of the economic calendar is not determinable from the available data. General risk controls remain important, including avoiding oversized exposure and allowing price to confirm its direction rather than reacting to a single intraday move.
Summary
- The weekly trend is firmly up, although its sub-trend is down.
- The daily trend is down and shaky, with an upward sub-trend.
- The key daily decision zone is 4331.294–4382.441.
- A sustained move above 4382.441 would strengthen the bullish CHoCH interpretation.
- Rejection below 4331.294 would keep the downside structure active toward 4288.216 and the lower support zones.
The single most important thing today is whether XAU/USD can establish acceptance above 4382.441 or is rejected back below 4331.294.
#XAUUSD #Gold #TechnicalAnalysis #PriceAction #DailyAnalysis
Meta description: XAU/USD tests 4331.294–4382.441 resistance as weekly strength conflicts with a shaky daily downtrend.
This article is technical analysis and reference information only, not investment advice. Markets carry risk, and readers are responsible for their own decisions.