
XAU/USD presents a mixed multi-timeframe picture. The weekly framework remains firmly upward, but its sub-trend is down, while the daily chart records a firm downtrend with an upward sub-trend. The latest daily close at 4072.344 is above the broken-retest area at 4023.812–4061.670, leaving price between nearby support and the larger resistance band at 4331.294–4382.441.
| Metric | Value |
|---|---|
| Most recent weekly close | 4043.851 |
| Most recent daily close | 4072.344 |
| Weekly trend | Up, firm; sub-trend down |
| Daily trend | Down, firm; sub-trend up |
| Nearest daily resistance | 4331.294–4382.441 |
| Nearest daily support | 3942.138–4005.629 |
| Active Fibonacci area | 4046.050 to 4110.334; current retracement ratio 0.296 |
| Daily ATR | 75.716 |
Higher-timeframe context
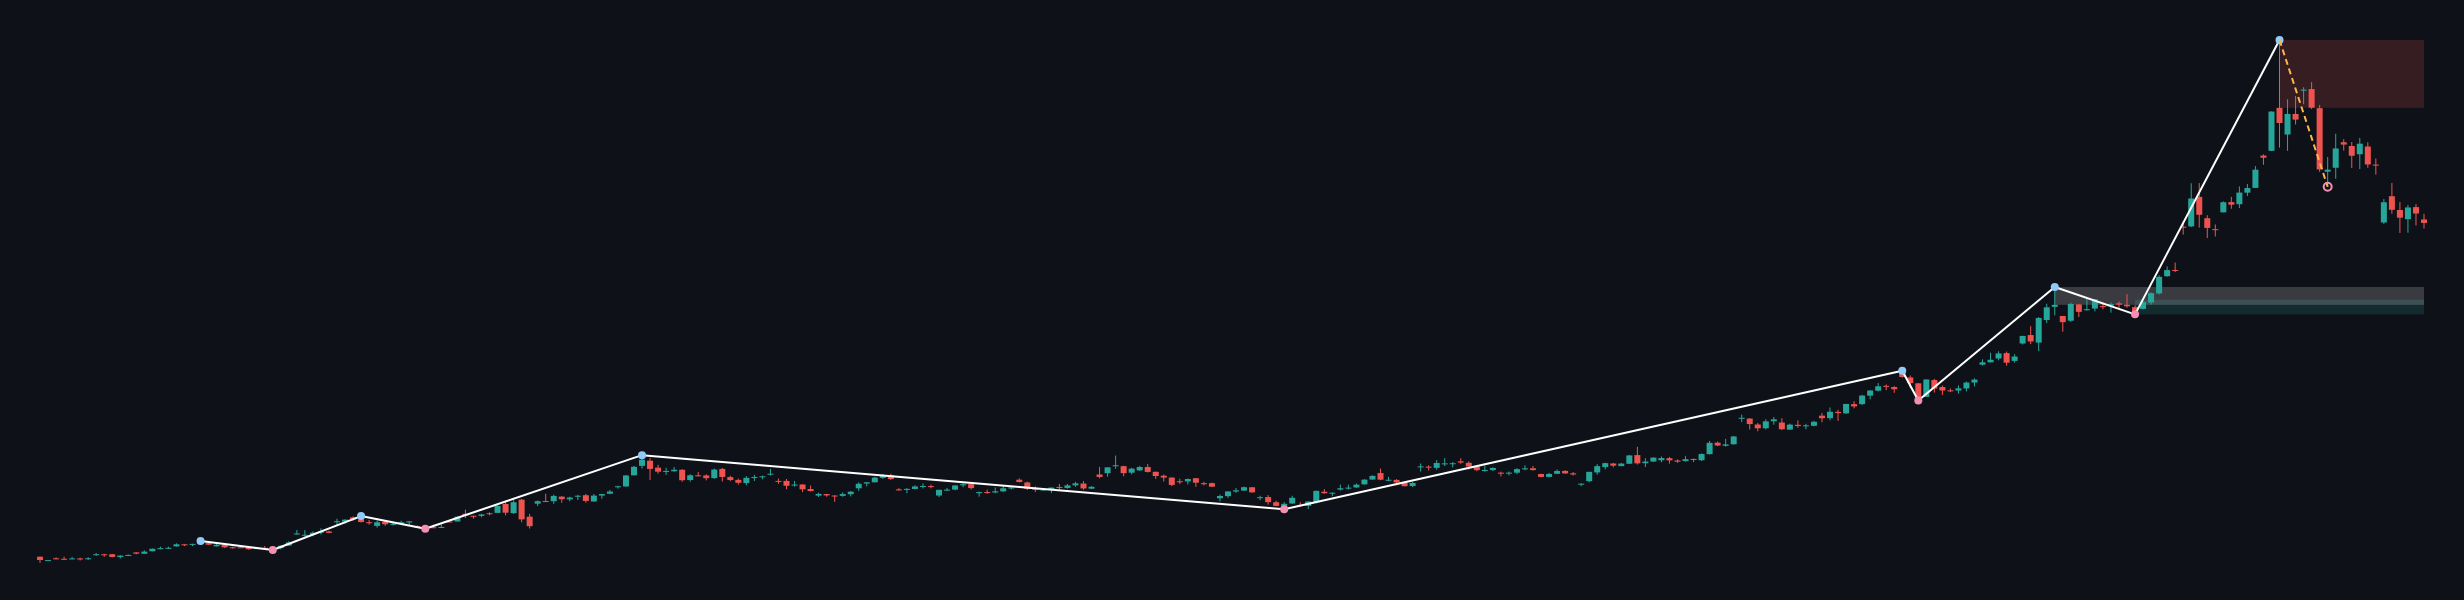
The weekly chart retains an upward primary structure, with no reported structure event and the most recent confirmed swing high at 5595.362. The weekly sub-trend is down, so the current decline should be treated as a counter-move within the larger upward framework unless the reported weekly support areas fail.
The main weekly resistance zone is 5019.871–5595.362. The major support zone is 3268.058–3392.201, while the broken-retest support area is 3349.000–3500.057. Relative to the weekly close at 4043.851, resistance remains above the market and both support areas remain below it. The weekly ATR is 248.286, indicating a broader price envelope than the daily ATR.
The weekly report does not provide a Fibonacci interaction or a weekly moving-average reading. The higher timeframe therefore permits a continued corrective phase, but its firm upward primary trend still gives the broader chart a bullish framework while price remains above the reported weekly support zones.
Main-frame structure
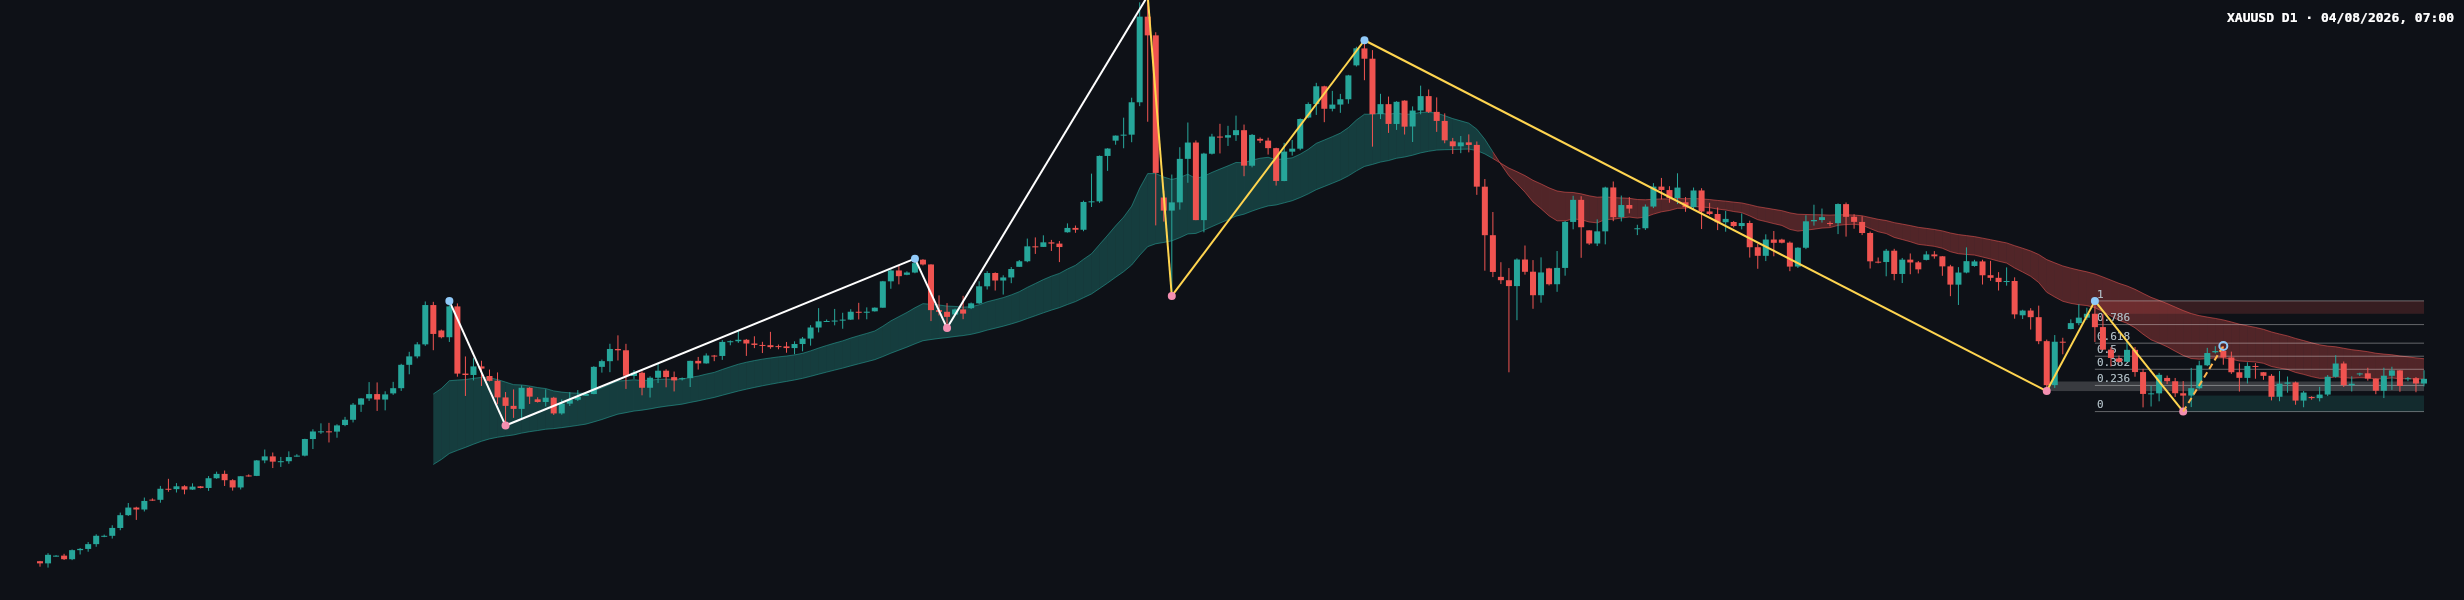
The daily trend is firmly down, while the sub-trend is up. This conflicts with the weekly primary direction and is best read as a daily recovery inside a broader weekly advance, although continued weakness would become more consequential if the daily support zone at 3942.138–4005.629 breaks.
The latest confirmed daily swing is a low at 3942.138, and no daily structure event is reported. Price is currently above the broken-retest resistance area at 4023.812–4061.670. That area is now important for judging whether the upward sub-trend can develop further or whether the daily downtrend is reasserting itself.
The latest completed Dow leg runs from 3942.138 to 4382.441. Its Fibonacci levels place 4046.050 at the 0.236 retracement, 4110.334 at the 0.382 retracement, 4162.290 at the 0.5 retracement, 4214.245 at the 0.618 retracement, and 4288.216 at the 0.786 retracement. The current retracement ratio is 0.296, placing the market above 4046.050 and below 4110.334.
The recent candles on the worker chart show a rebound from the area around 3942.138, followed by consolidation around the broken-retest band at 4023.812–4061.670. The visible price action does not establish a fresh daily structure event. Buyers have defended the lower area, but sellers remain relevant while price is below the larger resistance zone at 4331.294–4382.441.
Key levels
- 4331.294–4382.441: principal daily resistance and the upper portion of the latest completed Fibonacci leg.
- 4288.216: the 0.786 retracement level below the main resistance zone.
- 4214.245: the 0.618 retracement level.
- 4162.290: the 0.5 retracement level.
- 4110.334: the 0.382 retracement level and the next Fibonacci reference above the latest close.
- 4046.050: the 0.236 retracement level, close to the broken-retest area.
- 4023.812–4061.670: broken-retest resistance that is being tested as a potential support reference.
- 3942.138–4005.629: daily support, with 3942.138 also the latest confirmed daily swing low.
- 3268.058–3392.201 and 3349.000–3500.057: the principal weekly support references.
Scenarios
Bullish continuation
If price can hold above 4023.812–4061.670 and then establish acceptance above 4110.334, the upward daily sub-trend would have stronger technical confirmation. The next Fibonacci references would be 4162.290, 4214.245, 4288.216, and potentially the resistance zone at 4331.294–4382.441. This scenario would be invalidated by a decisive return below 4023.812–4061.670, with the broader downside test focused on 3942.138–4005.629. Its probability is not determinable from the deterministic report.
Bearish continuation
If the market rejects the area between 4046.050 and 4110.334 and breaks below 4005.629, sellers would be challenging the daily support zone at 3942.138–4005.629. A sustained move below 3942.138 would weaken the daily recovery and reinforce the firm daily downtrend. This scenario would be invalidated by sustained acceptance above 4110.334, with stronger invalidation evidence developing above 4331.294–4382.441. Its probability is not determinable from the deterministic report.
Range and failed-break scenario
Price may remain bounded between the broken-retest region at 4023.812–4061.670 and the broader resistance zone at 4331.294–4382.441. Repeated rejection near 4110.334 would keep the Fibonacci recovery contained, while repeated defense of 4005.629 would preserve the short-term upward sub-trend. This scenario would be invalidated by a sustained break beyond either boundary. Its probability is not determinable from the deterministic report.
Session considerations
The cleanest technical information would come from observing how price behaves around 4023.812–4061.670, 4046.050, and 4110.334. A confirmed hold above the broken-retest area would support the recovery scenario; rejection and a close below 4005.629 would instead direct attention to 3942.138.
False breaks are a material risk around the narrow broken-retest region. Gold can also experience liquidity sweeps and sharp movement during the European and US sessions. No news or economic-calendar information was supplied, so the timing of CPI, NFP, FOMC communication, central-bank remarks, DXY moves, US yields, and geopolitical headlines is not determinable from the report.
General risk control remains important: traders should account for the daily ATR of 75.716 and the weekly ATR of 248.286, avoid assuming that a level will hold, and consider the effect of event-driven volatility. The chart alone does not establish the likely behavior of any particular Asian, European, or US session.
Summary
- The weekly primary trend is firmly up, with the market above the reported weekly support zones.
- The daily primary trend is firmly down, but its sub-trend is up from the swing low at 3942.138.
- The key daily pivot area is 4023.812–4061.670, with 4046.050 and 4110.334 framing the active Fibonacci recovery.
- A move toward 4331.294–4382.441 would face major resistance, while a loss of 3942.138–4005.629 would weaken the recovery structure.
The single most important issue is whether price can sustain the recovery above 4023.812–4061.670 and progress beyond 4110.334, or whether sellers force a return toward 3942.138–4005.629.
#XAUUSD #Gold #PriceAction #ForexAnalysis #TechnicalAnalysis
Meta description: XAU/USD analysis covering weekly and daily trends, Fibonacci levels, support at 3942.138–4005.629, and resistance at 4331.294–4382.441.
This article is technical analysis and reference information only, not investment advice. Markets carry risk, and readers are responsible for their own decisions.