
XAU/USD closed at 4043.851. The higher-timeframe trend remains up (firm), but the daily trend is down (firm), creating a mixed structure rather than a clean directional signal. Price is consolidating around the daily broken-retest resistance zone at 4023.812–4064.373, with the current retracement ratio at 0.231, close to Fibonacci 0.236 at 4046.050.
| Metric | Value |
|---|---|
| Most recent close | 4043.851 |
| Weekly trend | Up (firm) |
| Daily trend | Down (firm) |
| Nearest resistance | 4023.812–4064.373 broken-retest zone; broader resistance at 4331.294–4382.441 |
| Nearest support | 3942.138–4005.629 |
| Active Fibonacci area | 0.236 at 4046.050; current retracement ratio 0.231 |
| Daily ATR | 81.122 |
Higher-timeframe context
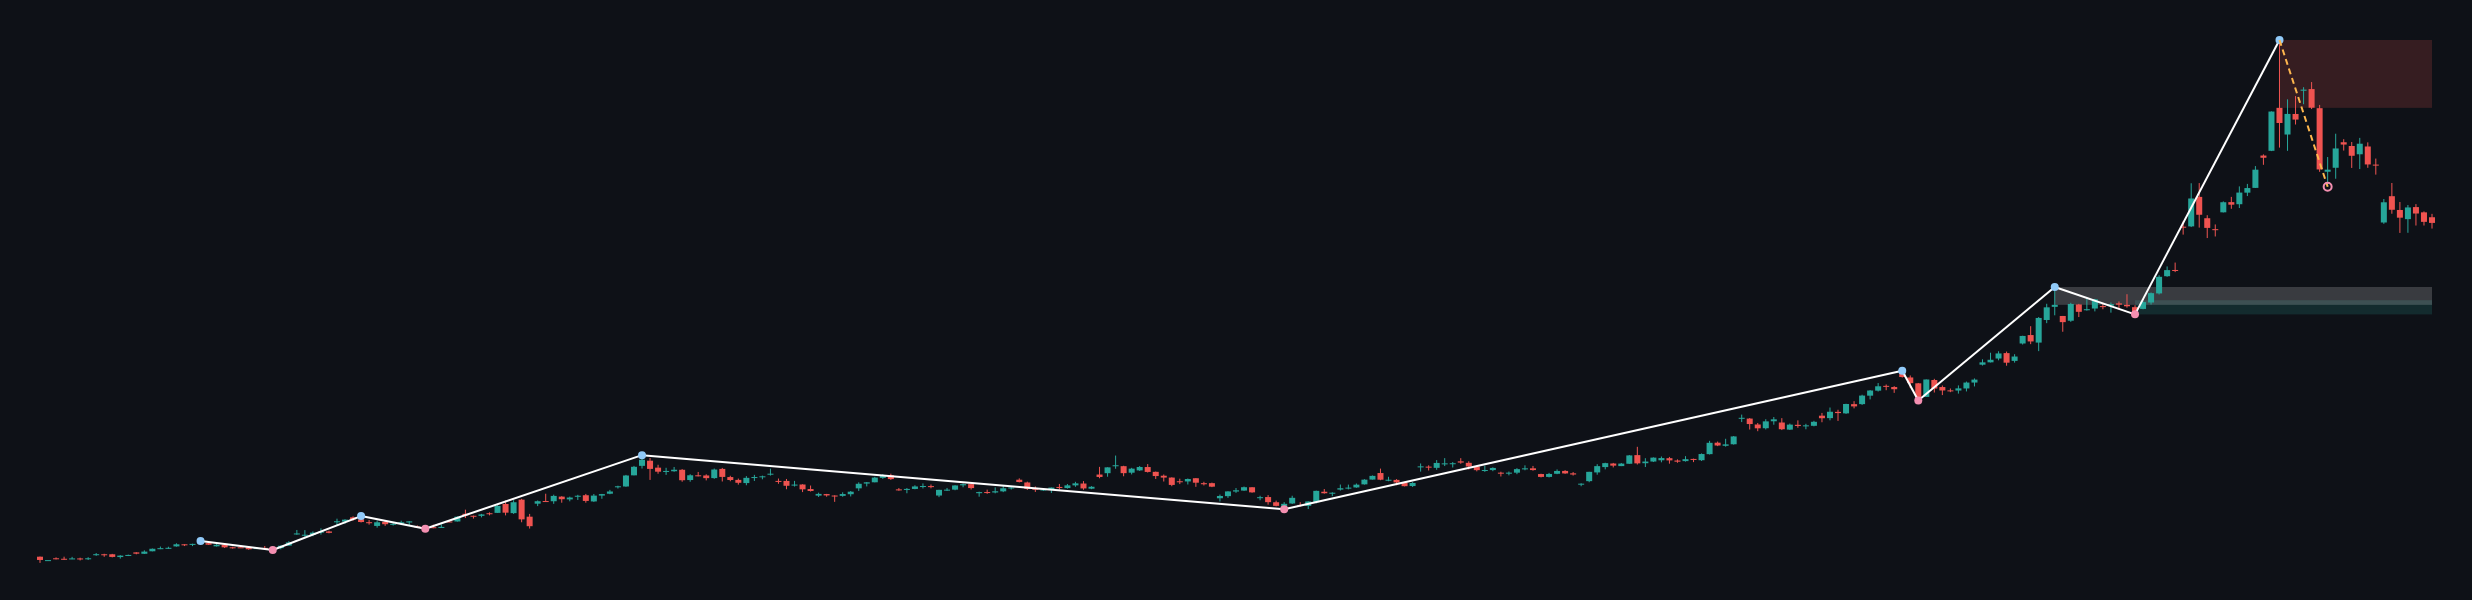
The weekly chart retains a firm upward main trend, while its sub-trend is down. The most recent confirmed weekly swing is a high at 5595.362, and the report identifies no weekly structure event. This means the pullback has not yet been classified as a confirmed structural reversal in the supplied data.
Weekly support is located at 3268.058–3387.504. A second zone at 3349.000–3500.057 is marked as a broken-retest area. Weekly resistance is placed at 5019.871–5595.362. The weekly ATR is 238.891. Distances from the current close to these zones are not provided in the report, so they are not quantified here.
The weekly chart therefore permits a continuation of the broader bullish framework, but the falling sub-trend leaves room for further correction. A sustained move away from the daily consolidation would be needed before the higher-timeframe trend and daily structure point in the same direction.
Main-frame structure
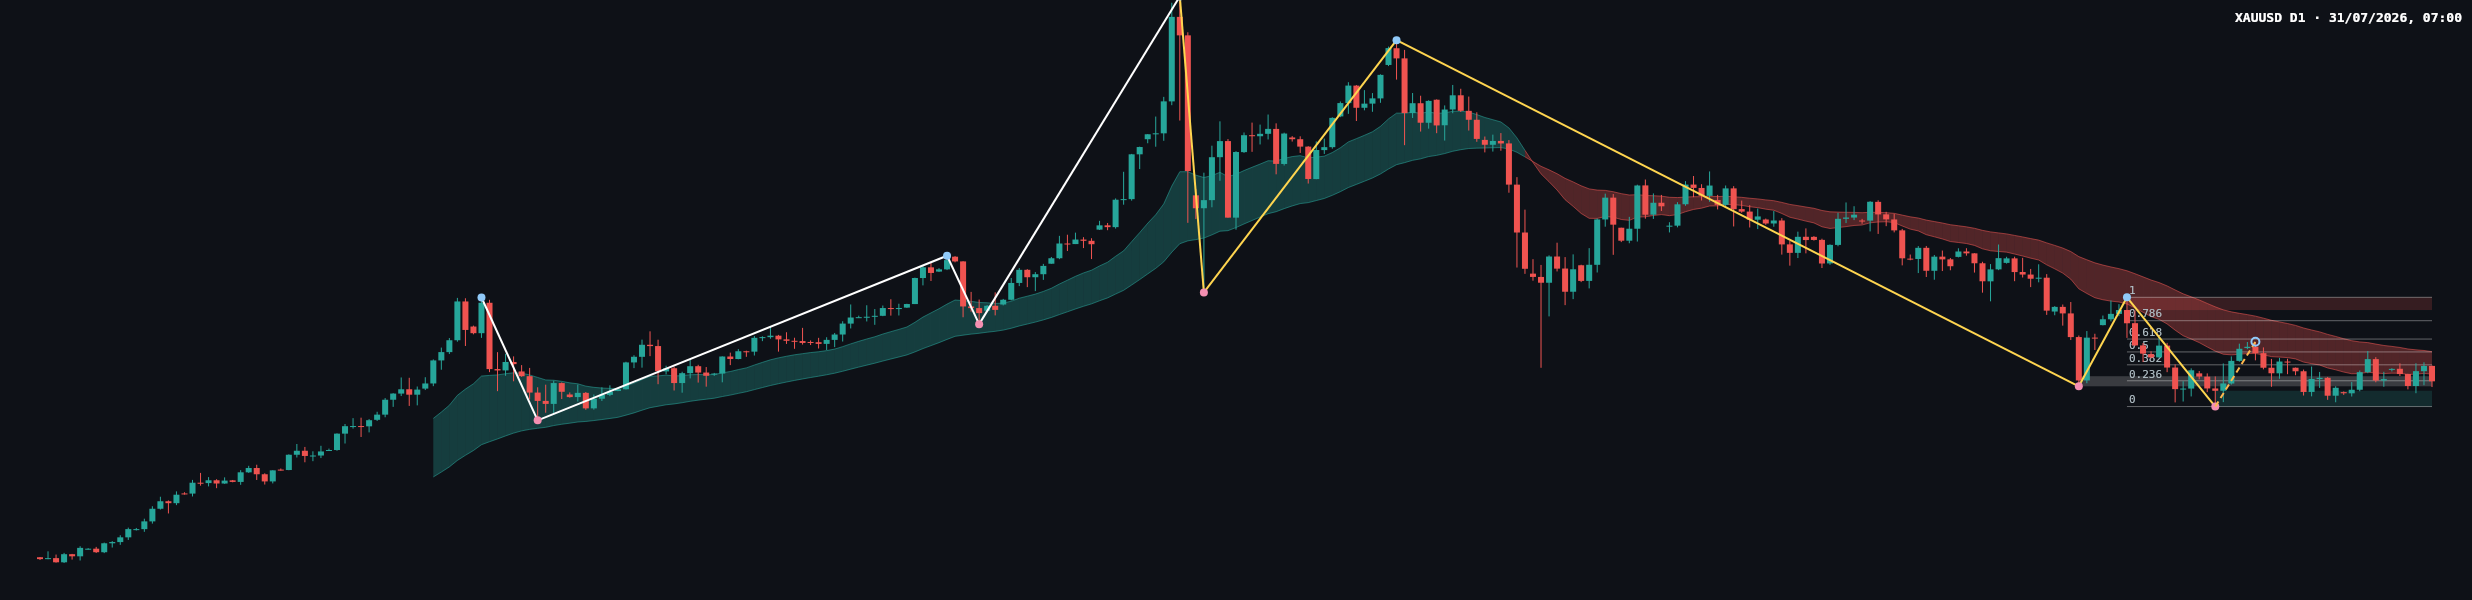
On the daily frame, the main trend is down (firm) and the sub-trend is up. This misalignment can represent a corrective recovery within the daily downtrend, although it could become an early reversal signal if price establishes itself above the relevant resistance structure. No daily structure event is recorded.
The most recent confirmed daily swing is a low at 3942.138. The principal daily support zone is 3942.138–4005.629. Above current price, the broken-retest resistance zone is 4023.812–4064.373, followed by resistance at 4331.294–4382.441.
The latest completed Dow leg has Fibonacci levels at 0: 3942.138, 0.236: 4046.050, 0.382: 4110.334, 0.5: 4162.290, 0.618: 4214.245, 0.786: 4288.216, and 1: 4382.441. With the current retracement ratio at 0.231, price is testing the area around 0.236. The reaction shown on the chart is consolidation rather than a confirmed break, so the level remains relevant while the daily structure is unresolved.
Reading the recent price action
The most recent candles on the daily chart are compact and mixed, with repeated tests around the 4023.812–4064.373 zone. The closing price at 4043.851 is close to Fibonacci 0.236 at 4046.050. The visible sequence does not present a decisive displacement candle or a confirmed structure break.
The candle story is therefore balanced. Sellers retain the advantage while price remains beneath the upper boundary at 4064.373, but buyers have defended the broader area around 3942.138–4005.629. A close back below 4005.629 would place attention on the support zone, while acceptance above 4064.373 would improve the case for a deeper Fibonacci recovery.
Exact moving-average values, candle-range comparisons, volume, and momentum readings are not included in the deterministic report. They are therefore not used to make a numerical or indicator-based claim.
Key levels
- 3942.138–4005.629: daily support zone and area surrounding the most recent confirmed low.
- 4023.812–4064.373: daily broken-retest resistance zone and immediate decision area.
- 4046.050: Fibonacci 0.236 level, near the latest close.
- 4110.334: Fibonacci 0.382 level above the immediate range.
- 4162.290: Fibonacci 0.5 level.
- 4214.245: Fibonacci 0.618 level.
- 4288.216: Fibonacci 0.786 level.
- 4331.294–4382.441: daily resistance zone and upper Fibonacci endpoint.
- 3268.058–3387.504 and 3349.000–3500.057: important weekly support areas.
- 5019.871–5595.362: major weekly resistance zone.
Scenarios
Bullish recovery scenario
If price closes above 4064.373 and holds that area on a retest, the recovery could extend toward 4110.334, then the broader resistance zone at 4331.294–4382.441. This scenario would be invalidated by a return below 4023.812 after the breakout. A percentage probability is not determinable from the supplied report.
Bearish continuation scenario
If price breaks below 4005.629, sellers could retest the lower portion of the support zone and the confirmed swing low at 3942.138. This scenario would be weakened or invalidated by a sustained move above 4064.373. A percentage probability is not determinable from the supplied report.
Range scenario
If price remains between 4005.629 and 4064.373, the current condition is best described as unresolved consolidation around Fibonacci 0.236 at 4046.050. A break outside that range would invalidate the range interpretation. A percentage probability is not determinable from the supplied report.
Session considerations
The cleanest confirmation would be a daily close beyond one side of the immediate decision area, followed by evidence that the broken boundary is being accepted rather than rejected. Traders should remain alert to false breaks and liquidity sweeps around 4023.812–4064.373, particularly when volatility expands.
DXY, US ten-year yields, the economic calendar, CPI, NFP, FOMC communication, Fed speakers, and geopolitical headlines are relevant external drivers for gold. No specific scheduled event or exact time window is supplied in the report. Asian, European, and US sessions can produce different volatility conditions, but no session-specific statistics are available here.
General risk controls remain important in either direction: keep exposure appropriate to the account, avoid making decisions solely from a single candle, and account for event-driven volatility. This is a framework for observing price behaviour, not an order recommendation.
Summary
- The weekly main trend is up (firm), but the weekly sub-trend is down.
- The daily main trend is down (firm), with an up sub-trend that has not produced a recorded structure event.
- The immediate decision area is 4023.812–4064.373.
- Support is 3942.138–4005.629, while the next Fibonacci reference above is 4110.334.
- The single most important thing today is whether price is accepted above 4064.373 or rejected back toward 4005.629.
Hashtags: #XAUUSD #Gold #PriceAction #DowTheory #TechnicalAnalysis
Meta description: XAU/USD analysis: weekly strength meets daily weakness as price consolidates between 4023.812 and 4064.373.
This article is technical analysis and reference information only, not investment advice. Markets carry risk, and readers are responsible for their own decisions.