
GBPUSD is pressing against its daily support zone after a decline from recent highs. The broader weekly trend remains down, although the weekly sub-trend is up; price is also near a weekly broken-retest resistance zone, leaving the short-term picture at an important point of tension.
Higher-timeframe context
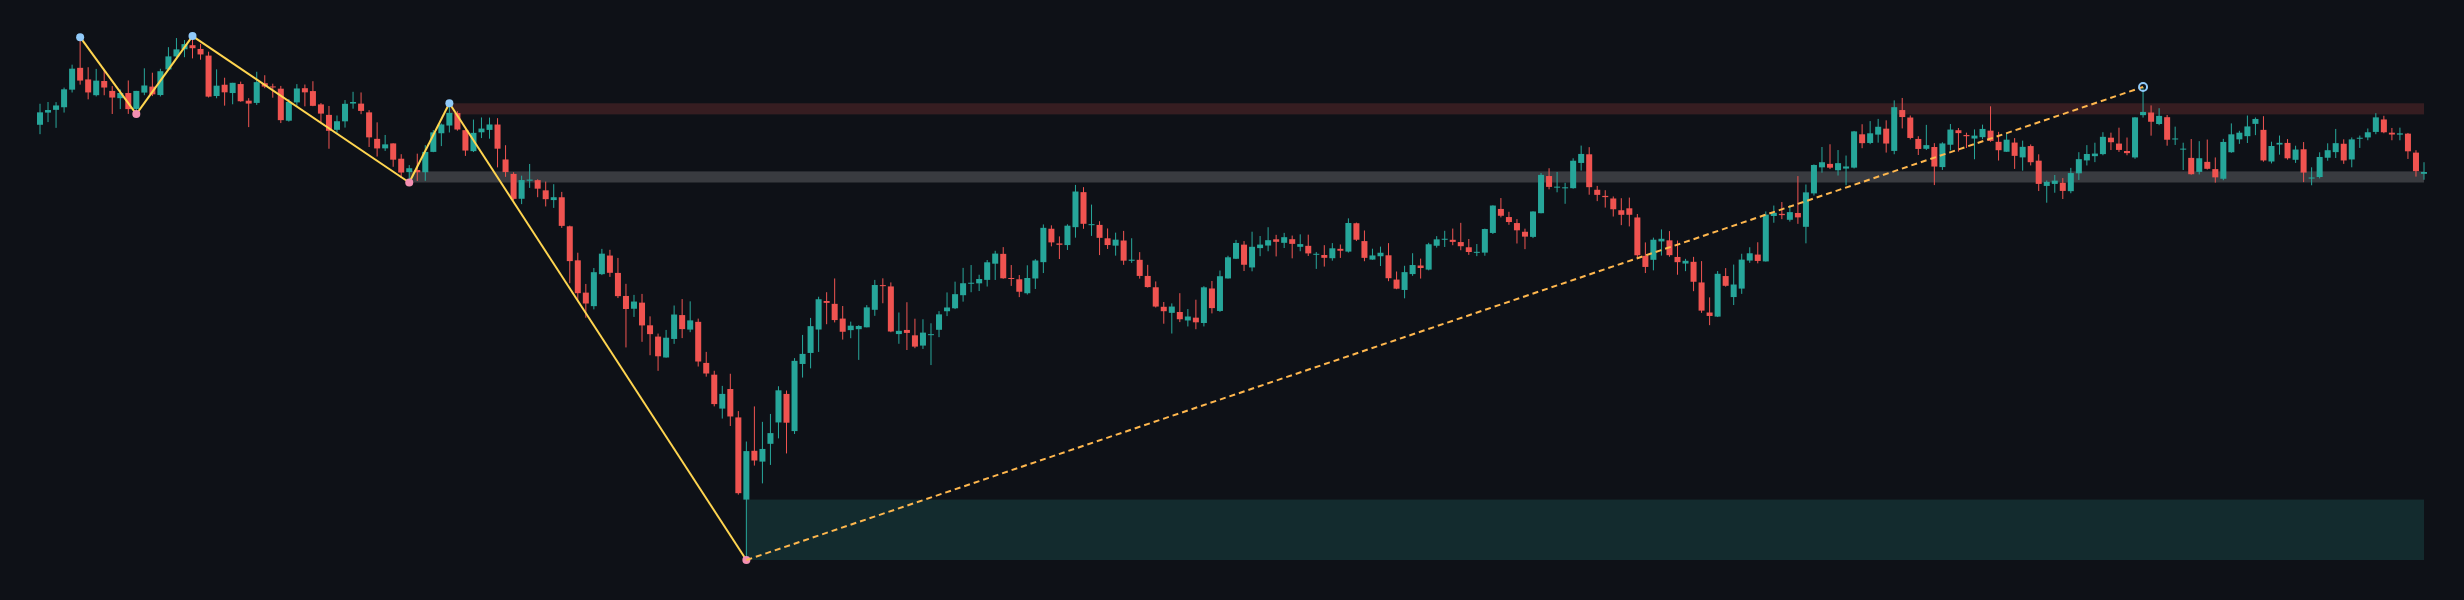
The weekly trend is down (firm), with an upward sub-trend and no reported structure event. The latest confirmed weekly swing is the low at 1.03535. The last closed price is 1.32378, within the weekly broken-retest resistance zone at 1.31602 – 1.32423. A higher resistance zone is 1.36666 – 1.37487, while the broad weekly support zone is 1.03535 – 1.08025.
This context allows for a continued recovery, but it does not establish a weekly reversal. A sustained move beyond the weekly resistance zone would improve the recovery picture; failure there would leave the broader downtrend relevant.
Main-frame structure
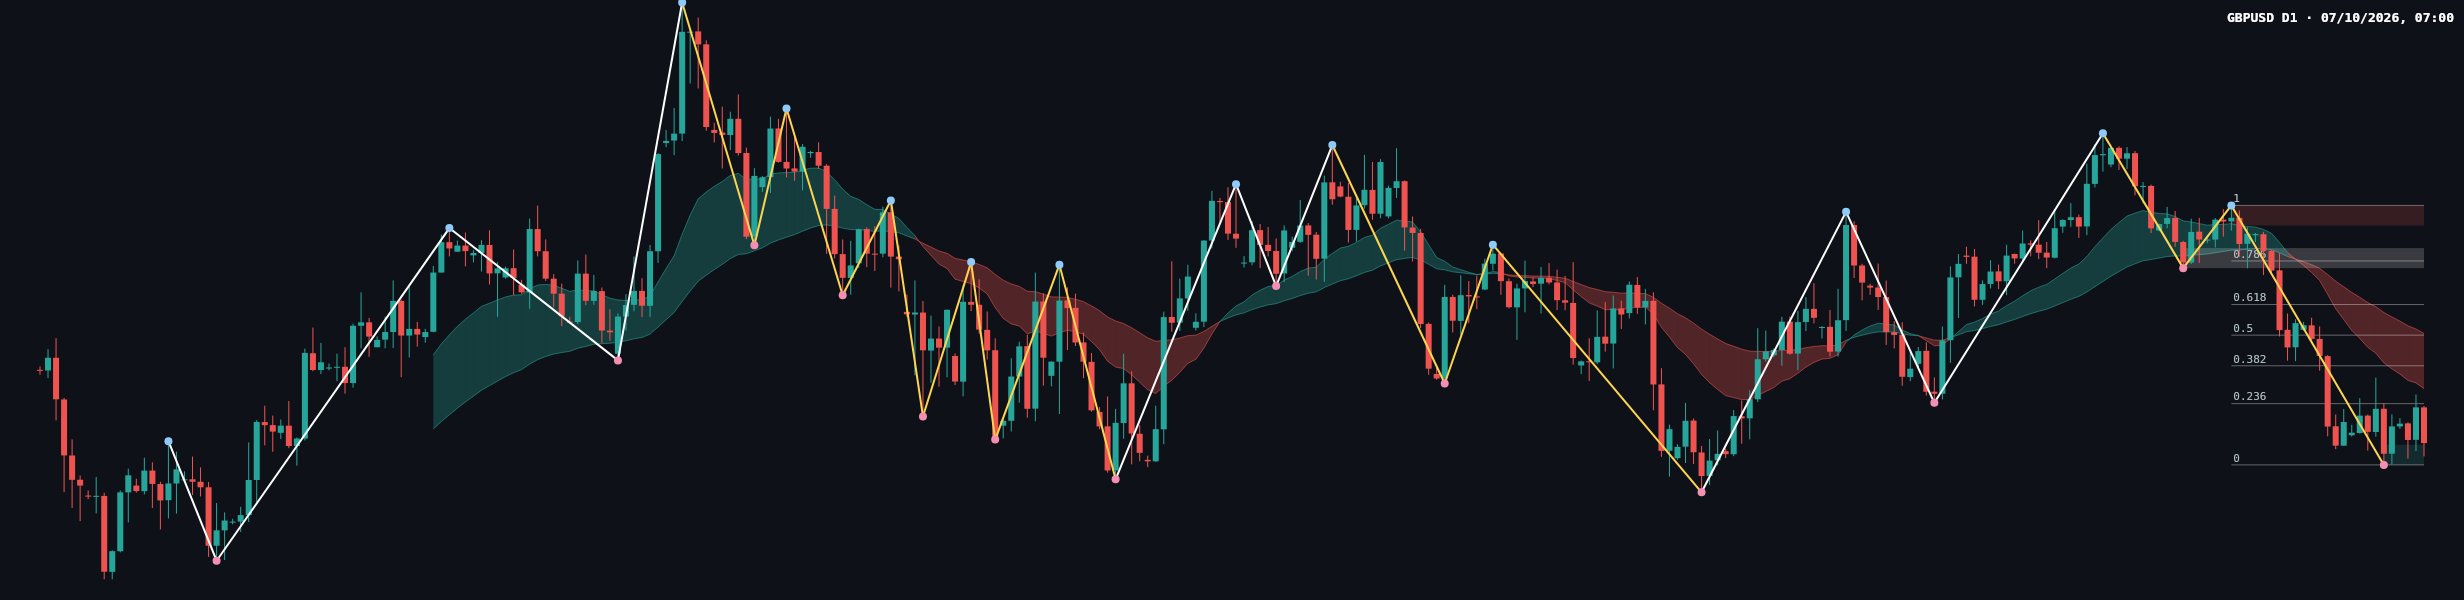
On the daily chart, the main trend is down (firm), while the sub-trend is up; no structure event is reported. The last closed price is 1.32129, just above the daily support zone at 1.31804 – 1.32102. The most recent confirmed swing low is 1.31804. The chart shows a recent decline from a swing high and price now trading near the lower end of the latest completed Dow leg.
The reported Fibonacci retracement ratio is 0.084. The nearby reference levels are 0 at 1.31804 and 0.236 at 1.32718; further retracement levels are 0.382 at 1.33283, 0.5 at 1.33740, 0.618 at 1.34197, and 0.786 at 1.34847. The leg’s 1 level is 1.35676. Price is close to the low end of this range, so any recovery would need to reclaim higher levels before the deeper retracements become relevant.
The report does not provide EMA readings, volume, or candle measurements, so their positions and signals are not determinable from the supplied data. The visible recent price action is consistent with selling pressure, but the proximity to support makes follow-through or a rebound important to watch.
Key levels
- Daily support: 1.31804 – 1.32102.
- Weekly broken-retest resistance: 1.31602 – 1.32423.
- Daily Fibonacci references: 1.32718, 1.33283, 1.33740, 1.34197, and 1.34847.
- Daily broken-retest resistance: 1.34740 – 1.35038.
- Higher daily resistance: 1.35378 – 1.35676.
- Broader weekly zones: resistance at 1.36666 – 1.37487 and support at 1.03535 – 1.08025.
Conditional scenarios
Bullish recovery
If price holds the daily support zone and moves back above the weekly resistance band at 1.31602 – 1.32423, the recovery case would strengthen. The next reported reference is 1.32718, followed by the daily broken-retest resistance at 1.34740 – 1.35038. A decisive move below 1.31804 would weaken this scenario.
Bearish continuation
If price breaks below the daily support zone, particularly beneath 1.31804, that would support continuation of the firm daily downtrend. The report supplies no nearer confirmed daily support target below this zone; the broader weekly support is 1.03535 – 1.08025. A move back above 1.32423 would weaken the immediate breakdown case.
Range and rejection
If neither side establishes a sustained move beyond the nearby zones, price may remain unsettled around the daily support and weekly resistance overlap. Repeated failure to hold above 1.32423 would limit the recovery case, while continued defense of 1.31804 – 1.32102 would complicate the bearish case.
Closing view
The daily chart is testing support within a broader weekly downtrend, while the weekly sub-trend remains upward. The reaction around 1.31804 – 1.32102 and whether price can sustain a move through 1.32423 are the key conditional signals to monitor.
This article is technical analysis for reference only, not investment advice. Markets carry risk, and readers are responsible for their own decisions.